
Why Teleoperation Data Is the Biggest Bottleneck in Physical AI
In a budget review we sat in on last quarter, a founder approved a seven-figure compute reservation in about ten minutes, then spent the next hour interrogating a $70k line for demonstration data. The compute felt legible: dollars per GPU-hour, a market price. The data line had no equivalent, because nobody in the room could say what an hour of human demonstration work actually yields.
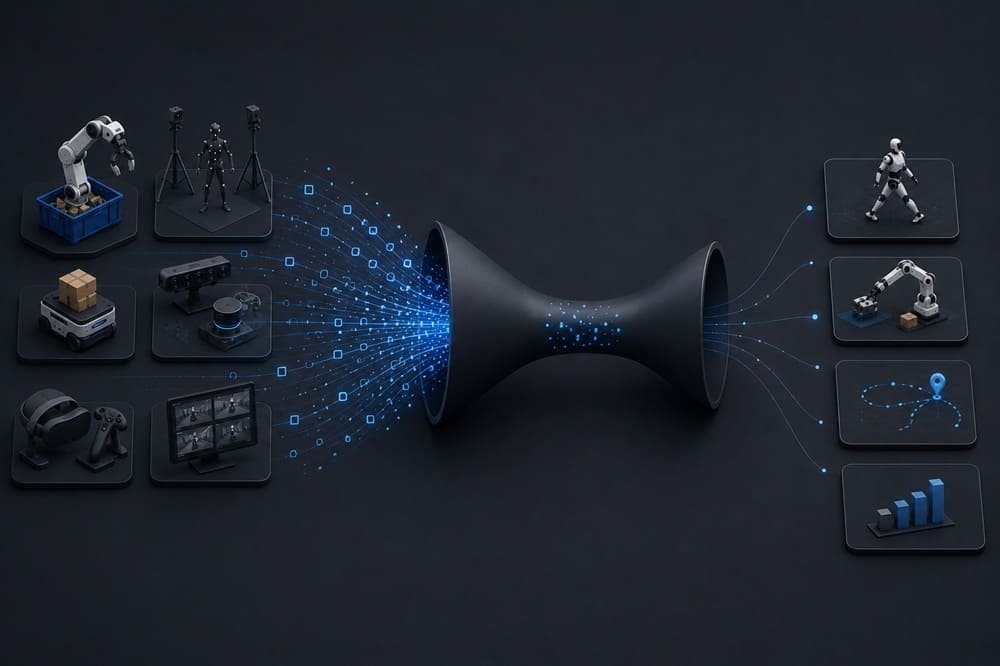
That asymmetry is the subject of this post, and the thesis is blunt: physical AI is not compute-bound, it is demo-bound. Language models trained on the internet. Vision models trained on the internet. Robot foundation models have no internet of action-labeled data, so every demonstration a VLA model consumes had to be manufactured: a person, at a rig, doing a task, one episode at a time. That production rate, not FLOPs, sets the pace of the field.
The gap exists because physical interaction data cannot be scraped. YouTube shows what hands do but not the joint torques, gripper commands, and proprioceptive states a policy needs as action labels. Simulation helps but leaks reality at every contact. That leaves teleoperation as the primary source of ground-truth action data, and teleoperation runs at human speed.
This post puts numbers on the bottleneck: how slow collection actually is, where the throughput hides, and the three levers that move it. The benchmarks are first-hand from our collection floors; the dataset math comes from published sources.
Key Takeaways – DROID, one of the largest open manipulation datasets, is 76,000 episodes and about 350 hours of interaction collected across 13 institutions (arxiv.org/abs/2403.12945). An LLM ingests more tokens than that dataset’s total information content in seconds. – A trained operator produces 25 to 40 usable episodes per hour. A novice produces 8 to 12. The ramp takes two to three weeks. – QA rejects 10 to 30 percent of episodes. Most teams forget to budget for it. – The three scaling levers, in order of impact: operator retention, task and rig ergonomics, automated QA at ingest.
The Bottleneck, Quantified
The teleoperation bottleneck is the mismatch between how fast foundation models can consume demonstration data and how fast humans can produce it. Consider what “large” means in robotics. Open X-Embodiment pooled over one million trajectories from 22 embodiments, drawing on years of collection by dozens of labs (arxiv.org/abs/2310.08864). DROID took 76,000 episodes across 564 scenes and stands as a landmark effort. Meanwhile a single humanoid program we support wants 50,000 episodes per quarter, for one product.
Run the arithmetic. At 30 usable episodes per operator-hour, 50,000 episodes is roughly 1,700 operator-hours before rejection. Add a realistic 15 percent QA rejection and you are near 2,000 hours: one operator working full-time for a year, or ten operators for five weeks, assuming every one of them is already trained. They will not be.
Where the Throughput Actually Goes
Throughput loss in teleoperation programs comes from three places: the operator ramp curve, episode overhead, and QA rejection. Each one quietly halves your effective rate if ignored.
The operator ramp curve is the two-to-three-week climb from novice to trained throughput. Our benchmarks are consistent: new operators deliver 8 to 12 usable episodes per hour in weeks one and two, then 25 to 40 once bimanual coordination and reset discipline become automatic. That is a 3x difference, which makes operator churn the most expensive line item nobody tracks. Lose a trained operator and you do not lose a salary; you lose three weeks of peak yield.
Episode overhead is everything between demonstrations: scene resets, object randomization, rig checks, breaks. On contact-rich tasks with careful resets, overhead can consume 40 percent of a shift. Task card design and reset tooling (marked object regions, reset jigs) pull that down more than exhortation ever will.
QA rejection runs 20 to 30 percent on a new task or rig and 10 to 15 percent in a mature pipeline. Sync skew between the 50 Hz action log and 30 fps cameras is the top rejection reason we see, followed by hesitant trajectories and failed completions. Rejection discovered at training time, weeks after collection, is pure loss; rejection at ingest is a correctable signal.
The Three Levers That Move the Number
Scaling teleoperation data collection means attacking retention, ergonomics, and ingest QA, in that order.
| Lever | Typical gain | Cost to implement |
|---|---|---|
| Operator retention and certification program | Sustains 25 to 40 eps/hr vs repeated novice resets | Low: pay, scheduling, progression path |
| Rig and task ergonomics (leader-follower feel, reset jigs) | 20 to 40 percent throughput on contact-rich tasks | Medium: GELLO-class leaders ~$300/arm, jig fabrication |
| Automated QA at ingest (sync, smoothness, completion gates) | Recovers the 10 to 30 percent otherwise lost silently | Medium: one engineer-month, then near-zero marginal |
A note on hardware, since teams often reach for it first. Moving from a $500 VR setup to a $20k ALOHA-class station improves fidelity on fine manipulation, and the original ACT results (80 to 90 percent success from about 50 demos, arxiv.org/abs/2304.13705) show what a well-matched rig enables. But hardware does not fix churn, and it does not fix silent QA loss. We have seen $300 GELLO leaders outproduce premium stations purely because the operators stayed.
A Worked Example: Sizing a 25,000-Episode Program
Program sizing is the exercise of converting an episode target into stations, headcount, and calendar time, with ramp and rejection built in rather than bolted on. Here is the arithmetic for a representative target of 25,000 QA-passed episodes in one quarter.
Start from the end. With a 15 percent rejection buffer, 25,000 passed episodes means collecting about 29,400. A trained operator averaging 30 usable episodes per hour, working six productive hours per shift, yields 180 episodes per day. Naively that is 164 operator-days, or three operators for the quarter. The naive answer is wrong in three ways.
First, ramp. If all three operators start as novices at 10 episodes per hour, the first three weeks produce a third of plan, which costs you roughly 5,000 episodes against the target. Either hire ahead of need or extend the calendar. Second, absence and churn. Floors run at 80 to 90 percent of rostered capacity over a quarter; one resignation among three operators is a 33 percent capacity event plus a new ramp curve. Third, task mix. Contact-rich bimanual tasks run at the bottom of the throughput range, and new tasks spike rejection to 20 to 30 percent for their first two weeks regardless of operator skill.
The sizing that actually holds: five operators across three stations (stations can run staggered shifts), a certification cohort starting two weeks before production, and a rejection buffer that starts at 25 percent for week one of each new task and decays to 15 percent. At $28 to $60 per all-in operator hour, the labor line for the quarter lands between roughly $27k and $70k depending on region and task complexity. That is the honest shape of the bottleneck: not impossible, just physical.
What This Means for Your Roadmap
The practical conclusion is that demonstration data needs the same planning rigor as compute. If your model roadmap says “100k episodes by Q2,” the collection plan behind it should specify stations, operator headcount with ramp assumptions, a rejection buffer of at least 15 percent, and an ingest QA gate that runs nightly. Teams that treat collection as an afterthought discover the bottleneck at the worst possible time: after the training cluster is reserved.
The full playbook, including rig selection tables and per-episode cost math, is in our complete guide to teleoperation data collection.
Frequently Asked Questions
Why is teleoperation data the bottleneck in physical AI?
Because action-labeled interaction data cannot be scraped from the web; it must be produced by human operators at 25 to 40 usable episodes per hour at best. Model capacity and compute scale far faster than human demonstration throughput.
How fast can one operator collect demonstration data?
Our benchmarks: 8 to 12 usable episodes per hour for a novice, rising to 25 to 40 after two to three weeks of ramp. Contact-rich bimanual tasks sit at the low end, simple pick-place at the high end.
How much teleoperation data do VLA models need?
Multi-task training typically needs thousands of episodes per skill family. For reference, Open X-Embodiment pooled over one million trajectories from 22 embodiments, and single-task ACT policies can succeed with about 50 clean demonstrations.
What percentage of teleoperation data fails QA?
Expect 20 to 30 percent rejection on new tasks or rigs and 10 to 15 percent in a mature pipeline. The top causes are timestamp skew between streams, dropped frames, and failed task completions.
Can simulation replace teleoperation data?
Not yet for contact-rich manipulation. Simulation supplements real data and helps with evaluation, but sim-to-real gaps in contact dynamics and perception mean most production policies still train primarily on real teleoperated demonstrations.

Enoch Pakanati
Enoch Pakanati is the strategic architect behind DexSet’s mission to become the undisputed market leader in robotics training data. He oversees the company’s growth strategy, focusing on capturing dominant market share across all data modalities required for modern robotics, including egocentric capture, teleoperation, and simulation-to-real data pipelines.
At DexSet, Enoch is responsible for transforming the company’s deep technical capabilities into a market-leading brand that foundation model labs and robotics OEMs trust implicitly. He focuses on scaling DexSet’s global footprint and ensuring the company stays ahead of the industry’s rapidly evolving data needs. His leadership is centered on one objective: making DexSet the singular, global standard for the data that powers the robotics revolution.