
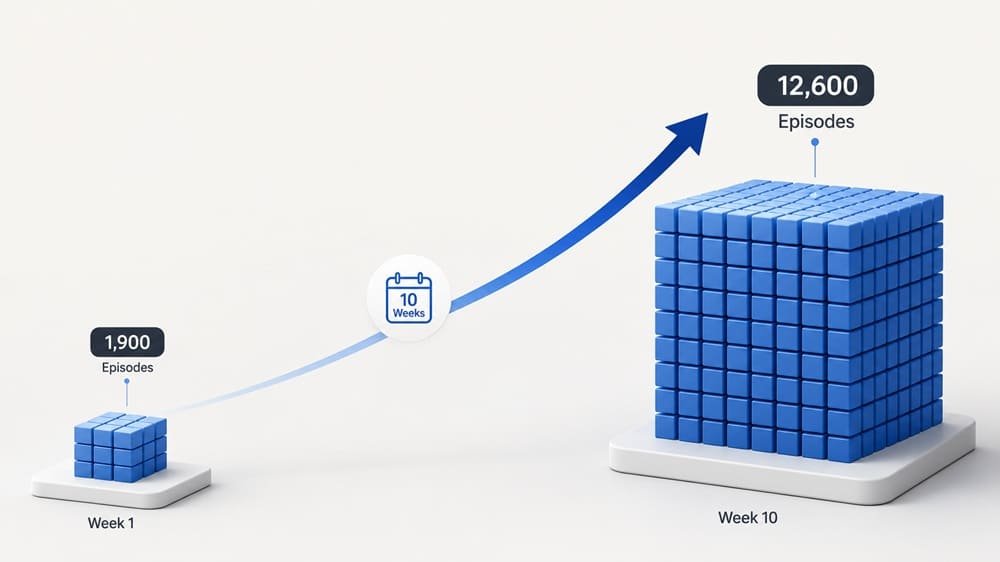
A head of data once asked us which of their 1,900 collected episodes had actually made their policy better, and we could not tell them; neither could they, because nothing in their pipeline had ever connected episodes to outcomes. That question came from the team this case study is about: eight weeks into their own collection effort, 1,900 episodes against a 12,000-episode target, a 34 percent QA rejection rate, and a training deadline that had already slipped once. Their ML team was strong. Their collection operation was two engineers moonlighting as floor managers, and it showed.
This is the common failure shape, and it is the thesis of this case study. Collection stalls not because anyone lacks skill but because demonstration data is an operations problem wearing an ML costume: staffing, ergonomics, and QA gating, none of which appear in the papers. The papers do tell you what is possible; ACT hit 80 to 90 percent success from about 50 clean demos per task (arxiv.org/abs/2304.13705). Getting 12,000 clean demos across 40 tasks is a different discipline.
Here is exactly what we changed, week by week, including the two things that failed. Use it as a template for your own program, or as an argument for not running one in-house.
Key Takeaways – Baseline: 1,900 episodes in 8 weeks, 34 percent rejection. Outcome: 12,600 QA-passed episodes in 10 weeks, 12 percent final rejection. – Six leader-follower stations plus a two-week operator certification program did most of the work. – Automated ingest QA (sync skew, smoothness, completion gates) cut silent data loss to near zero. – Client’s ACT baseline improved from 41 to 68 percent average success across their internal 40-task eval. – Peak steady-state: about 1,400 usable episodes per week from 8 operators.
The Starting Point: Why 1,900 Episodes Took Eight Weeks
The client’s bottleneck was a stack of small losses, not one big one. Their audit told the story: two VR stations shared among rotating volunteers, no defined operator roles, no reset protocol, and QA performed manually by an ML engineer, at training time, weeks after collection. Rejection ran 34 percent, dominated by timestamp skew between their 50 Hz action logs and 30 fps cameras, plus inconsistent initial states that made half the “passing” episodes weak training signal anyway.
Their effective yield was under 60 usable episodes per day. At that rate the 12,000-episode target sat more than eight months out.
What We Changed
The intervention had four parts: stations, people, protocol, and gates. In order of impact:
1. Stations. We replaced the two shared VR rigs with six bimanual leader-follower stations (GELLO-class leaders on the client’s arms, roughly $300 per leader plus fabrication), keeping one VR station for the mobile-base tasks where it fit better. Joint-level control cut trajectory hesitancy immediately and shortened operator ramp.
2. People. Eight dedicated operators on a two-week certification program: task cards, reset drills, and a throughput gate (20 usable episodes per hour on a reference task) before touching production tasks. Our standard ramp curve applied; novices started at 8 to 12 usable episodes per hour and certified operators stabilized at 25 to 40.
3. Protocol. Written task cards for all 40 tasks, marked randomization zones for object placement, success criteria defined at collection time, and per-episode metadata (task, operator, rig, success) attached at the source.
4. Gates. Automated ingest QA running nightly: inter-stream sync skew over 33 ms flagged, dropped-frame counts, jerk thresholds on joint trajectories, and completion labels verified against a sampled human review. Failures routed back to the floor as next-morning feedback per operator, which mattered as much as the gate itself.
The Week-by-Week Numbers
Weekly usable output tells the ramp story better than any narrative.
| Week | Usable episodes | Rejection rate | Notes |
|---|---|---|---|
| 1 | 310 | 29% | Station bring-up; operators in certification |
| 2 | 540 | 26% | First cohort certified; jig redesign after reset failures |
| 3 | 980 | 19% | All 8 operators on production tasks |
| 4 | 1,390 | 15% | Steady state reached |
| 5 to 9 | 1,300 to 1,450/wk | 11 to 14% | Two task cards rewritten after eval feedback |
| 10 | 1,280 | 12% | Target passed: 12,600 total QA-passed |
Two failures worth admitting. In week two, our first reset jig for a deformable-object task increased reset time instead of cutting it; operators beat the jig by hand and we scrapped it. And one of the 40 tasks, bimanual jar opening, ran a stubborn 25 percent rejection until week six, when slowing the commanded demonstration pace fixed what better hardware had not.
Did the Data Actually Help? Policy Results
The point of episode counts is policy performance, so the client re-trained their ACT baseline on the new corpus at week eleven. Average success across their internal 40-task evaluation went from 41 percent (trained on their original 1,900 mixed-quality episodes) to 68 percent, with the largest gains on precision tasks where the old VR data had been noisiest. Same architecture, same hyperparameter budget, different data. Their team’s summary, which we will keep quoting: “We spent six months on model changes for less improvement than ten weeks of better data.”
That is one program, not a controlled study, and we flag it as such. But it matches the pattern across our floors and the published record: demonstration quality moves policy success more reliably than architecture iteration at this stage of the field.
What We Would Do Differently
Every program teaches something, and this one taught us three corrections we have since made standard. First, we would start the operator certification cohort a full week before station bring-up finishes, not after. Waiting for hardware serialized two ramps that could have run in parallel, and it cost the program most of week one’s output. Second, we would pilot every task card ourselves before handing it to operators. Two of the 40 cards contained ambiguous success criteria (“lid secured” without a torque or rotation definition), and the resulting label inconsistency did not surface until the week-five training run flagged suspicious loss on exactly those tasks. A ten-minute pilot per card would have caught both. Third, we would set the deformable-object tasks to a slower commanded pace from day one. The week-six discovery that pace, not hardware, drove the jar-opening rejection rate had been sitting in the per-task rejection data since week two; we were looking at floor-level averages and missed it. Per-task dashboards are now default on every program we run.
None of these are exotic lessons. That is rather the point: scaling demonstration data is a discipline of small, boring corrections applied early, and the gap between 1,900 episodes and 12,600 episodes was made of exactly such corrections.
The Reusable Checklist
Scaling teleoperation collection comes down to seven decisions made early:
- Match rig to task family (leader-follower for fine bimanual work; VR for mobile/humanoid tasks)
- Dedicated, certified operators, never rotating volunteers
- A throughput gate before production collection
- Written task cards with randomization zones and success criteria
- Hardware timestamps on every stream; sync checked at ingest, not at training
- Nightly automated QA with per-operator feedback loops
- A rejection buffer of at least 15 percent in the episode target
Rig options, cost-per-episode math, and QA thresholds are covered in depth in the complete teleoperation data collection guide.
Frequently Asked Questions
How many episodes does a VLA model program need?
Program-dependent, but the humanoid teams we support typically target 10,000 to 50,000 QA-passed episodes per quarter across dozens of tasks. Single-task ACT policies can work from about 50 clean demos; multi-task generalization is what drives volume.
How long does it take to scale a teleoperation data program?
With rigs, certified operators, and ingest QA in place, expect three to four weeks to steady state. This program reached about 1,400 usable episodes per week from 8 operators by week four.
What rejection rate should I budget for?
At least 15 percent at maturity and 25 to 30 percent during the first two weeks of any new task or rig. Budgeting zero rejection is the most common planning error we see.
Is it cheaper to collect teleoperation data in-house or outsource it?
In-house costs more than teams expect once engineer time is counted; the client here spent eight engineer-weeks producing data that mostly failed QA. Outsourcing wins on time-to-data in most cases; in-house wins when collection is itself a core competency you intend to build.
What improved policy success most in this case study?
Rig fidelity and QA gating together. Joint-level leader-follower control removed trajectory hesitancy, and ingest gates stopped skewed episodes from reaching training. Success rose from 41 to 68 percent with no model changes.