Dexset

5 Hidden Challenges in Teleoperation Data Collection (and How to Solve Them)

One house rule on our collection floor reliably surprises visitors: no episode ships the day it is collected, however clean it looks on the monitor, because every episode waits for the overnight QA gate first. The rule exists because the visible challenges in teleoperation, buying rigs, hiring operators, picking a data format, are the ones teams plan for. The hidden challenges surface at episode 5,000, when the dataset is half-collected, the deadline is fixed, and the training run just exposed a flaw that has been silently poisoning every episode since week one.

That is the thesis of this post: the failures that actually kill teleoperation datasets are invisible in any single episode and only show up in aggregate, so the fix is instrumentation at ingest, not heroics at training time. Each problem looks like a minor engineering detail until it compounds. A 40-millisecond timestamp offset is invisible in a demo video. Spread across 10,000 episodes, it is the difference between a 70 percent policy and a 45 percent one.

Below are the five failures we see most often across the programs we run and audit, each with the fix we actually use. If you are new to the space, start with the complete teleoperation data collection guide and come back.

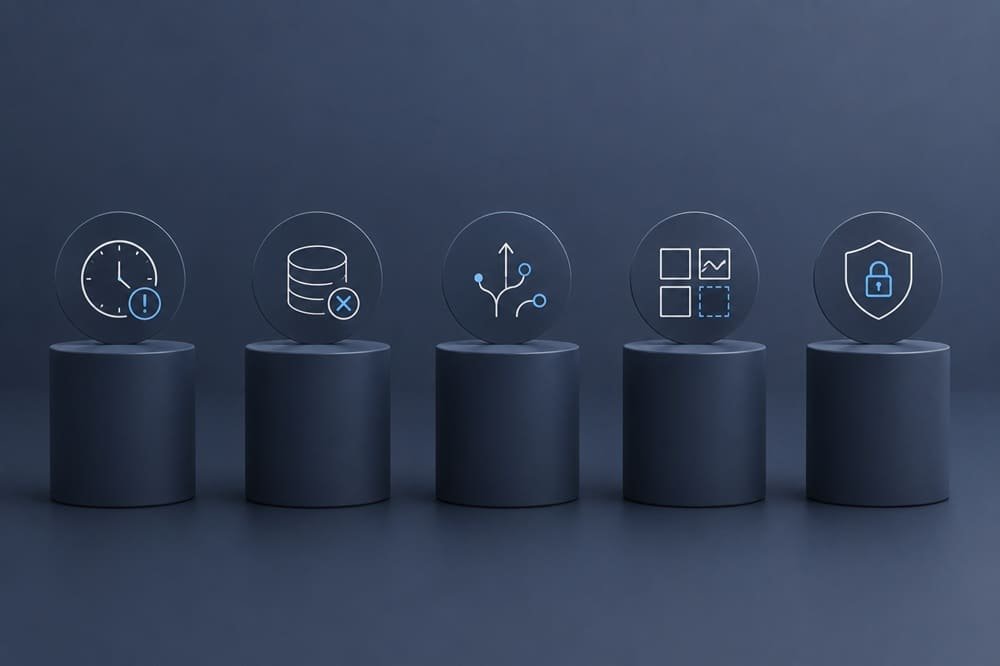
Key Takeaways – Timestamp skew between 50 Hz actions and 30 fps cameras is the top QA rejection cause we see. Gate at 33 ms, at ingest. – Operator churn is a 3x throughput event, not an HR footnote: trained operators produce 25 to 40 usable episodes per hour versus 8 to 12 for novices. – Reset drift quietly narrows your state distribution; randomization zones fix it. – QA discovered at training time is loss; QA at ingest is feedback. Expect 10 to 30 percent rejection either way, so choose when you find out. – Format decisions are nearly irreversible after 10,000 episodes. Adopt LeRobot conventions on day one.

1. Timestamp Skew: The 50 Hz vs 30 fps Trap

Timestamp skew is the misalignment between a robot’s high-rate action stream and its lower-rate camera streams, and it is the single most common reason episodes fail our QA gates. Actions log at 50 Hz; cameras deliver 30 fps; USB buffering, clock drift between machines, and software timestamps assigned at receipt rather than exposure can push streams 30 to 100 ms apart. A policy trained on skewed data learns that consequences precede actions. It will move confidently and miss.

The fix. Hardware timestamps at the sensor wherever the camera supports it; a single shared monotonic clock otherwise; and an ingest gate that rejects any episode with estimated inter-stream skew above one camera frame (33 ms). We also log a clap-style sync event at the start of each shift as a cheap ground-truth check. Action chunking in ACT-style training tolerates per-step jitter, but no algorithm recovers from systematic offset (arxiv.org/abs/2304.13705).

2. Operator Churn: The Throughput Cliff

Operator churn is the loss of trained teleoperators before their throughput has paid back their ramp cost. The ramp curve is steep: 8 to 12 usable episodes per hour in the first two weeks, 25 to 40 after certification. Every departure resets a station to novice yield for two to three weeks, which means a floor with 20 percent monthly churn is quietly running at two-thirds of its rated capacity.

The fix. Treat operators as skilled technicians, because they are. Certification gates with pay progression, per-operator quality dashboards (people improve what they can see), 45-minute session blocks on VR rigs to manage fatigue, and rig ergonomics worth caring about. Leader-follower stations retain operators better than SpaceMouse benches for the simple reason that the work feels like skill rather than struggle.

3. Reset Drift: The Shrinking State Distribution

Reset drift is the gradual narrowing of initial-state diversity as operators unconsciously converge on the fastest reset, placing objects in the same pose, episode after episode. Nobody notices because every individual episode passes QA. The policy trains beautifully, evaluates beautifully on the collection table, then fails the moment an object appears five centimeters left of its usual spot. This is how teams end up with 10,000 episodes of one initial state.

The fix. Marked randomization zones on the workspace, task cards that specify pose ranges, and a distribution monitor in the QA pipeline that plots initial object positions per task per week. When the scatter tightens, the floor lead hears about it the next morning. Datasets like DROID earned their generalization value from scene diversity, 564 scenes across 76,000 episodes, not from episode count alone (arxiv.org/abs/2403.12945).

4. Silent QA Loss: Finding Out at Training Time

Silent QA loss is the gap between episodes collected and episodes actually usable, discovered only when someone trains on the data weeks later. Rejection is not the problem; 10 to 30 percent rejection is normal and we publish those numbers. The problem is timing. Rejection found at ingest becomes operator feedback and a corrected process by tomorrow. Rejection found at training time is a hole in the dataset, a slipped deadline, and no way to know which of the last six weeks went wrong.

The fix. Nightly automated gates on every episode: sync skew, dropped frames, joint-trajectory jerk thresholds, gripper event sanity, and success-label verification against a sampled human review. Route failures to the specific operator and rig. Our floors run this as a standing morning report, and it is the highest-ROI engineering month a data program can spend.

5. Format Lock-In: The Decision You Make Once

Format lock-in is the practical irreversibility of episode schema decisions once collection is underway, because re-processing tens of thousands of episodes costs more than most teams will ever approve. Missing per-episode metadata, camera intrinsics never recorded, action spaces defined ambiguously (commanded versus measured joint positions, unlabeled): each omission is trivial to fix on day one and a migration project at episode 20,000.

The fix. Adopt community conventions before the first production episode: LeRobot dataset format for training and sharing (github.com/huggingface/lerobot), HDF5 or ROS 2 bags at capture (docs.ros.org), both commanded and measured joint states recorded, camera intrinsics and extrinsics stored per rig per calibration, and schema versioning from v0. Fifteen minutes of schema review now, or fifteen days of migration later.

How to Audit Your Own Pipeline This Week

A pipeline audit is a half-day exercise that estimates your exposure to all five hidden challenges using data you already have. No new tooling required, in most cases.

Pull ten random episodes from last month and compute the maximum camera-to-control timestamp offset per episode; anything over 33 ms means challenge one is live in your dataset right now. Ask your floor lead for usable-episodes-per-hour by operator tenure; if you cannot get the number, that absence is itself the finding. Scatter-plot initial object positions for your highest-volume task across weeks one and four of collection; visibly tightening scatter is reset drift in progress. Check when rejection is discovered: if the answer involves a training run, you have silent QA loss by definition. And finally, hand an episode file to an engineer who has never seen your schema and time how long it takes them to load actions, states, and calibrated camera streams; over thirty minutes predicts format pain at scale.

Every one of these checks has caught a live problem on programs we have audited, including our own. The five challenges are not exotic failure modes; they are the default state of a pipeline that nobody has audited yet.

The Checklist

Hidden challenge Detection signal Fix Cost of ignoring
Timestamp skew Skew estimate > 33 ms at ingest Hardware timestamps + sync gate Policies that act early/late; top rejection cause
Operator churn Throughput below 20 eps/hr floor-wide Certification, pay progression, ergonomics Floor runs at ~2/3 capacity
Reset drift Initial-state scatter tightening week over week Randomization zones + distribution monitor Policy memorizes one layout
Silent QA loss Rejection discovered at training time Nightly ingest gates + operator feedback 10 to 30% of budget wasted invisibly
Format lock-in Schema questions at training time LeRobot conventions + schema v0 Migration project at episode 20k

Next Step

Ready to scope your data program? Talk to our team.

Frequently Asked Questions

What is the most common QA failure in teleoperation data?

Inter-stream timestamp skew, typically between 50 Hz action logs and 30 fps camera streams. We gate at 33 ms of estimated skew and it remains the top rejection reason on new rigs.

Expect 20 to 30 percent rejection during the first two weeks on a new task or rig, settling to 10 to 15 percent in a mature pipeline. Budget the buffer into episode targets.

Usually reset drift: operators converge on repeated initial states during collection, so the dataset covers a narrow state distribution. Randomization zones and initial-state monitoring prevent it.

At ingest, nightly, never later. Rejection found at ingest becomes next-day operator feedback; rejection found at training time is unrecoverable loss weeks after the fact.

LeRobot dataset conventions for training and sharing, with HDF5 or ROS 2 bags at capture. Record both commanded and measured joint states, camera calibration per rig, and version the schema from the start.
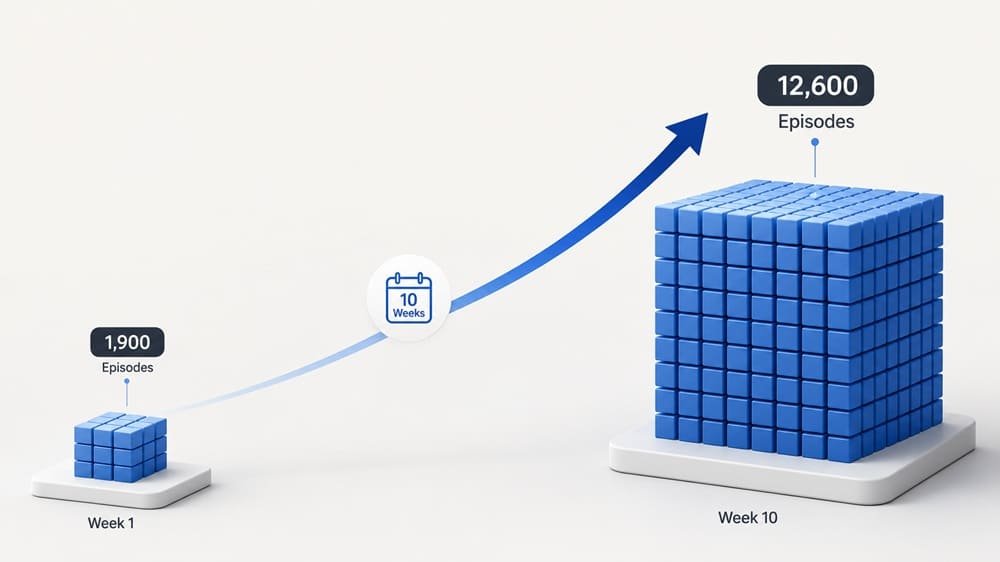
Case Study: Scaling Teleoperation Data for a VLA Model, 1,900 to 12,600 Episodes in Ten Weeks

A head of data once asked us which of their 1,900 collected episodes had actually made their policy better, and we could not tell them; neither could they, because nothing in their pipeline had ever connected episodes to outcomes. That question came from the team this case study is about: eight weeks into their own collection effort, 1,900 episodes against a 12,000-episode target, a 34 percent QA rejection rate, and a training deadline that had already slipped once. Their ML team was strong. Their collection operation was two engineers moonlighting as floor managers, and it showed.

This is the common failure shape, and it is the thesis of this case study. Collection stalls not because anyone lacks skill but because demonstration data is an operations problem wearing an ML costume: staffing, ergonomics, and QA gating, none of which appear in the papers. The papers do tell you what is possible; ACT hit 80 to 90 percent success from about 50 clean demos per task (arxiv.org/abs/2304.13705). Getting 12,000 clean demos across 40 tasks is a different discipline.

Here is exactly what we changed, week by week, including the two things that failed. Use it as a template for your own program, or as an argument for not running one in-house.

Key Takeaways – Baseline: 1,900 episodes in 8 weeks, 34 percent rejection. Outcome: 12,600 QA-passed episodes in 10 weeks, 12 percent final rejection. – Six leader-follower stations plus a two-week operator certification program did most of the work. – Automated ingest QA (sync skew, smoothness, completion gates) cut silent data loss to near zero. – Client’s ACT baseline improved from 41 to 68 percent average success across their internal 40-task eval. – Peak steady-state: about 1,400 usable episodes per week from 8 operators.

The Starting Point: Why 1,900 Episodes Took Eight Weeks

The client’s bottleneck was a stack of small losses, not one big one. Their audit told the story: two VR stations shared among rotating volunteers, no defined operator roles, no reset protocol, and QA performed manually by an ML engineer, at training time, weeks after collection. Rejection ran 34 percent, dominated by timestamp skew between their 50 Hz action logs and 30 fps cameras, plus inconsistent initial states that made half the “passing” episodes weak training signal anyway.

Their effective yield was under 60 usable episodes per day. At that rate the 12,000-episode target sat more than eight months out.

What We Changed

The intervention had four parts: stations, people, protocol, and gates. In order of impact:

1. Stations. We replaced the two shared VR rigs with six bimanual leader-follower stations (GELLO-class leaders on the client’s arms, roughly $300 per leader plus fabrication), keeping one VR station for the mobile-base tasks where it fit better. Joint-level control cut trajectory hesitancy immediately and shortened operator ramp.

2. People. Eight dedicated operators on a two-week certification program: task cards, reset drills, and a throughput gate (20 usable episodes per hour on a reference task) before touching production tasks. Our standard ramp curve applied; novices started at 8 to 12 usable episodes per hour and certified operators stabilized at 25 to 40.

3. Protocol. Written task cards for all 40 tasks, marked randomization zones for object placement, success criteria defined at collection time, and per-episode metadata (task, operator, rig, success) attached at the source.

4. Gates. Automated ingest QA running nightly: inter-stream sync skew over 33 ms flagged, dropped-frame counts, jerk thresholds on joint trajectories, and completion labels verified against a sampled human review. Failures routed back to the floor as next-morning feedback per operator, which mattered as much as the gate itself.

The Week-by-Week Numbers

Weekly usable output tells the ramp story better than any narrative.

Week Usable episodes Rejection rate Notes
1 310 29% Station bring-up; operators in certification
2 540 26% First cohort certified; jig redesign after reset failures
3 980 19% All 8 operators on production tasks
4 1,390 15% Steady state reached
5 to 9 1,300 to 1,450/wk 11 to 14% Two task cards rewritten after eval feedback
10 1,280 12% Target passed: 12,600 total QA-passed

Two failures worth admitting. In week two, our first reset jig for a deformable-object task increased reset time instead of cutting it; operators beat the jig by hand and we scrapped it. And one of the 40 tasks, bimanual jar opening, ran a stubborn 25 percent rejection until week six, when slowing the commanded demonstration pace fixed what better hardware had not.

Did the Data Actually Help? Policy Results

The point of episode counts is policy performance, so the client re-trained their ACT baseline on the new corpus at week eleven. Average success across their internal 40-task evaluation went from 41 percent (trained on their original 1,900 mixed-quality episodes) to 68 percent, with the largest gains on precision tasks where the old VR data had been noisiest. Same architecture, same hyperparameter budget, different data. Their team’s summary, which we will keep quoting: “We spent six months on model changes for less improvement than ten weeks of better data.”

That is one program, not a controlled study, and we flag it as such. But it matches the pattern across our floors and the published record: demonstration quality moves policy success more reliably than architecture iteration at this stage of the field.

What We Would Do Differently

Every program teaches something, and this one taught us three corrections we have since made standard. First, we would start the operator certification cohort a full week before station bring-up finishes, not after. Waiting for hardware serialized two ramps that could have run in parallel, and it cost the program most of week one’s output. Second, we would pilot every task card ourselves before handing it to operators. Two of the 40 cards contained ambiguous success criteria (“lid secured” without a torque or rotation definition), and the resulting label inconsistency did not surface until the week-five training run flagged suspicious loss on exactly those tasks. A ten-minute pilot per card would have caught both. Third, we would set the deformable-object tasks to a slower commanded pace from day one. The week-six discovery that pace, not hardware, drove the jar-opening rejection rate had been sitting in the per-task rejection data since week two; we were looking at floor-level averages and missed it. Per-task dashboards are now default on every program we run.

None of these are exotic lessons. That is rather the point: scaling demonstration data is a discipline of small, boring corrections applied early, and the gap between 1,900 episodes and 12,600 episodes was made of exactly such corrections.

The Reusable Checklist

Scaling teleoperation collection comes down to seven decisions made early:

  • Match rig to task family (leader-follower for fine bimanual work; VR for mobile/humanoid tasks)
  • Dedicated, certified operators, never rotating volunteers
  • A throughput gate before production collection
  • Written task cards with randomization zones and success criteria
  • Hardware timestamps on every stream; sync checked at ingest, not at training
  • Nightly automated QA with per-operator feedback loops
  • A rejection buffer of at least 15 percent in the episode target

Rig options, cost-per-episode math, and QA thresholds are covered in depth in the complete teleoperation data collection guide.

Next Step

Ready to scope your data program? Talk to our team.

Frequently Asked Questions

How many episodes does a VLA model program need?

Program-dependent, but the humanoid teams we support typically target 10,000 to 50,000 QA-passed episodes per quarter across dozens of tasks. Single-task ACT policies can work from about 50 clean demos; multi-task generalization is what drives volume.

With rigs, certified operators, and ingest QA in place, expect three to four weeks to steady state. This program reached about 1,400 usable episodes per week from 8 operators by week four.

At least 15 percent at maturity and 25 to 30 percent during the first two weeks of any new task or rig. Budgeting zero rejection is the most common planning error we see.

In-house costs more than teams expect once engineer time is counted; the client here spent eight engineer-weeks producing data that mostly failed QA. Outsourcing wins on time-to-data in most cases; in-house wins when collection is itself a core competency you intend to build.

Rig fidelity and QA gating together. Joint-level leader-follower control removed trajectory hesitancy, and ingest gates stopped skewed episodes from reaching training. Success rose from 41 to 68 percent with no model changes.

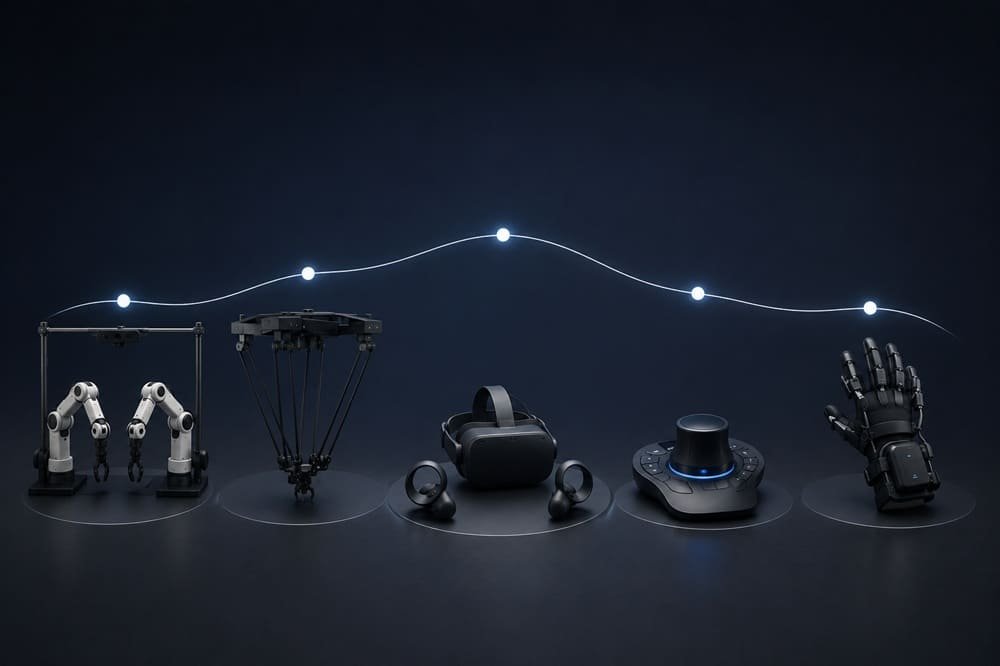
Teleoperation Approaches Compared: ALOHA, GELLO, VR, SpaceMouse, and UMI

Budget first. Task second. That ordering, common as it is, ruins more teleoperation datasets than any hardware defect we have debugged. Rig selection is where programs are quietly won or lost, months before anyone trains a policy: pick a rig mismatched to your task family and you pay twice, once in operator throughput, again in data quality that caps policy performance no matter how many episodes you buy.

Our thesis in this post is the reversal of that ordering: choose the rig by task family, and let budget break ties. The mismatch happens because rigs get chosen by price or by whatever the last paper used, not by task requirements. A SpaceMouse is a fine tool that will still ruin a bimanual insertion dataset. A $20k ALOHA station is superb hardware that is overkill for single-arm pick-and-place.

This post compares the five approaches we run in production, with costs, throughput observations, and the failure modes that only show up after a few thousand episodes. Hardware claims cite the primary papers; throughput and maintenance numbers are ours.

Key Takeaways – Leader-follower rigs (ALOHA ~$20k, Mobile ALOHA ~$32k) give the highest control fidelity for fine bimanual work (arxiv.org/abs/2304.13705, arxiv.org/abs/2401.02117). – GELLO delivers most of that fidelity for roughly $300 per leader arm if you already own the robots (arxiv.org/abs/2309.13037). – VR teleop scales: DROID collected 76,000 episodes with a Quest 2 controller (arxiv.org/abs/2403.12945); Open-TeleVision extends it to humanoids (arxiv.org/abs/2407.01512). – UMI collects without a robot for under $1,500 per device (arxiv.org/abs/2402.10329). – Match rig to task family first, budget second. The decision matrix below is the shortcut.

Leader-Follower Arms: ALOHA and Kin

A leader-follower rig pairs a small passive “leader” arm that the operator moves by hand with a “follower” robot that mirrors leader joint positions at 50 Hz. Direct joint mapping skips inverse kinematics entirely, so operators feel the robot’s kinematics through their hands and singularities never surprise them. Stanford’s ALOHA, roughly $20k for the full bimanual cell, set the reference design, and its ACT results (80 to 90 percent success on fine tasks from ~50 demos) remain the standard proof that rig fidelity converts to policy performance. Mobile ALOHA adds a base for about $32k total.

In production the strengths hold: fastest operator ramp of any rig we run (days, not weeks) and the best fine-manipulation data. The costs are per-station capital and embodiment lock-in; the data transfers cleanly only to matching kinematics.

GELLO: Fidelity at a Tenth of the Price

GELLO is a low-cost leader arm built from Dynamixel hobby servos and 3D-printed links, kinematically scaled to match a specific follower robot, at roughly $300 per arm. If you already own Franka, UR, or xArm followers, GELLO adds leader-follower control for the price of a decent office chair, and our throughput on GELLO stations matches full ALOHA cells within noise on most tasks.

The honest downside is maintenance. Printed parts wear, servos strip, and each new follower model needs a scaled leader design. Budget a part-time technician per six to eight stations. Still the best throughput-per-dollar in the field, in our experience.

VR Teleoperation: Quest 3 and Open-TeleVision-Style Rigs

VR teleoperation maps headset and controller (or hand-tracking) poses to robot end-effector targets through an IK solver, trading joint-level fidelity for cheap, portable, immersive control. The scaling evidence is strong: DROID’s 76,000 episodes across 564 scenes came from Quest 2 controllers on Franka arms. For humanoids, Open-TeleVision streams an active stereo head camera into the headset so the operator sees what the robot sees, which is currently the most practical way to teleoperate whole upper-body humanoid tasks.

Watch for two production issues. IK artifacts near joint limits put subtle discontinuities into action streams that policies later reproduce. And a minority of operators fatigue quickly in-headset; we schedule VR operators in 45-minute blocks for that reason. Ramp runs one to two weeks, slower than leader-follower.

SpaceMouse: The Prototyping Workhorse

A SpaceMouse is a 6-DoF desktop puck ($150 to $450) that commands end-effector twist, and it is the right tool for lab prototyping and simple single-arm tasks rather than production collection. Throughput on contact-rich work is the worst of the five approaches; decoupled rotation and translation control never becomes intuitive for dexterous tasks. We keep one on every debug bench and none on the collection floor.

UMI: Demonstrations Without a Robot

UMI (Universal Manipulation Interface) is a handheld gripper with a wrist-mounted fisheye camera that records demonstrations directly from human hand motion, recovering poses via SLAM, no robot in the loop. Device cost is under $1,500, collection can happen anywhere, and it is the only approach that produces data before your robot ships. The trade-offs: pose quality depends on SLAM conditions, and the human-to-robot embodiment gap means UMI data usually supplements rather than replaces on-robot teleop.

Cost and Throughput Comparison

The table below combines published hardware costs with our observed operator throughput at maturity (usable episodes per hour on a moderate bimanual or single-arm task).

Rig Hardware cost Trained throughput (eps/hr) Operator ramp Fine bimanual quality Maintenance load
ALOHA leader-follower ~$20k (~$32k mobile) 30 to 40 2 to 5 days Excellent Low
GELLO + your robot ~$300 per leader arm 28 to 38 2 to 5 days Very good Medium (printed parts)
VR (Quest 3 class) $500 to $3,500 + robot 20 to 32 1 to 2 weeks Good, IK-limited Low
SpaceMouse $150 to $450 + robot 8 to 15 Never fully ramps on dexterous work Poor Low
UMI handheld <$1,500 per device 35 to 50 (no resets on robot) 1 to 3 days N/A (robot-free) Low, SLAM-sensitive

The Costs the Spec Sheets Leave Out

Total cost of ownership for a teleoperation rig includes calibration time, maintenance labor, and operator fatigue effects that never appear on a purchase order. Three examples from our own floors. GELLO stations cost us about two technician-hours per station per week in printed-part replacement and servo checks; cheap hardware, recurring labor. VR rigs cost almost nothing to maintain but lose 10 to 15 percent of scheduled operator time to session-length limits we impose for headset fatigue, and IK edge cases add a QA review burden that leader-follower rigs simply do not generate. ALOHA-class stations are the opposite trade: high capital, low ongoing attention, and the fastest path to trained-operator throughput. When you model a year of operation rather than a purchase, the gap between a $300 leader and a $20k cell narrows considerably; it rarely closes, but the ranking can flip for programs where technician time is scarcer than capital.

One more line item: re-rigging. Task families evolve, and a rig locked to one workspace geometry gets rebuilt more often than anyone forecasts. Budget a rebuild per station per quarter in active programs and you will be close.

Decision Matrix: Which Rig for Which Program

Choose by task family first: fine bimanual manipulation demands leader-follower (ALOHA if funded, GELLO if you own arms); humanoid and mobile manipulation demands VR with active head cameras; broad in-the-wild diversity or pre-hardware collection points to UMI; and SpaceMouse stays in the lab. Mixed programs are normal. Our own floors run GELLO for depth on core tasks and UMI for breadth across scenes, which is the pairing we recommend most often to VLA teams.

Full rig economics, QA thresholds, and the pipeline from demos to policy live in the complete teleoperation data collection guide.

Next Step

Ready to scope your data program? Talk to our team.

Frequently Asked Questions

Is GELLO as good as ALOHA for data collection?

For most tasks, close enough that the price difference decides it. GELLO gives joint-level leader-follower control at ~$300 per arm versus ~$20k for a full ALOHA cell, with similar operator throughput in our experience. ALOHA wins on build quality and out-of-box reliability.

Yes. DROID collected 76,000 episodes using Quest 2 controllers driving Franka arms across 13 institutions. Plan for IK artifact QA checks and shorter operator sessions to manage headset fatigue.

From roughly $300 (GELLO leader, robot excluded) to ~$20k (ALOHA bimanual cell) to ~$32k (Mobile ALOHA). VR setups run $500 to $3,500 plus the robot; UMI handheld devices come in under $1,500.

For simple single-arm pick-and-place and prototyping, yes. For contact-rich or bimanual tasks, no; throughput and trajectory quality lag every alternative, and policies inherit the hesitant motion.

Use it alongside, not instead. UMI excels at cheap scene diversity and pre-hardware collection, but the embodiment gap means on-robot teleop still anchors most production training sets.

Download sample data or book a rig consultation with our systems team.

Why Teleoperation Data Is the Biggest Bottleneck in Physical AI

In a budget review we sat in on last quarter, a founder approved a seven-figure compute reservation in about ten minutes, then spent the next hour interrogating a $70k line for demonstration data. The compute felt legible: dollars per GPU-hour, a market price. The data line had no equivalent, because nobody in the room could say what an hour of human demonstration work actually yields.

That asymmetry is the subject of this post, and the thesis is blunt: physical AI is not compute-bound, it is demo-bound. Language models trained on the internet. Vision models trained on the internet. Robot foundation models have no internet of action-labeled data, so every demonstration a VLA model consumes had to be manufactured: a person, at a rig, doing a task, one episode at a time. That production rate, not FLOPs, sets the pace of the field.

The gap exists because physical interaction data cannot be scraped. YouTube shows what hands do but not the joint torques, gripper commands, and proprioceptive states a policy needs as action labels. Simulation helps but leaks reality at every contact. That leaves teleoperation as the primary source of ground-truth action data, and teleoperation runs at human speed.

This post puts numbers on the bottleneck: how slow collection actually is, where the throughput hides, and the three levers that move it. The benchmarks are first-hand from our collection floors; the dataset math comes from published sources.

Key Takeaways – DROID, one of the largest open manipulation datasets, is 76,000 episodes and about 350 hours of interaction collected across 13 institutions (arxiv.org/abs/2403.12945). An LLM ingests more tokens than that dataset’s total information content in seconds. – A trained operator produces 25 to 40 usable episodes per hour. A novice produces 8 to 12. The ramp takes two to three weeks. – QA rejects 10 to 30 percent of episodes. Most teams forget to budget for it. – The three scaling levers, in order of impact: operator retention, task and rig ergonomics, automated QA at ingest.

The Bottleneck, Quantified

The teleoperation bottleneck is the mismatch between how fast foundation models can consume demonstration data and how fast humans can produce it. Consider what “large” means in robotics. Open X-Embodiment pooled over one million trajectories from 22 embodiments, drawing on years of collection by dozens of labs (arxiv.org/abs/2310.08864). DROID took 76,000 episodes across 564 scenes and stands as a landmark effort. Meanwhile a single humanoid program we support wants 50,000 episodes per quarter, for one product.

Run the arithmetic. At 30 usable episodes per operator-hour, 50,000 episodes is roughly 1,700 operator-hours before rejection. Add a realistic 15 percent QA rejection and you are near 2,000 hours: one operator working full-time for a year, or ten operators for five weeks, assuming every one of them is already trained. They will not be.

Where the Throughput Actually Goes

Throughput loss in teleoperation programs comes from three places: the operator ramp curve, episode overhead, and QA rejection. Each one quietly halves your effective rate if ignored.

The operator ramp curve is the two-to-three-week climb from novice to trained throughput. Our benchmarks are consistent: new operators deliver 8 to 12 usable episodes per hour in weeks one and two, then 25 to 40 once bimanual coordination and reset discipline become automatic. That is a 3x difference, which makes operator churn the most expensive line item nobody tracks. Lose a trained operator and you do not lose a salary; you lose three weeks of peak yield.

Episode overhead is everything between demonstrations: scene resets, object randomization, rig checks, breaks. On contact-rich tasks with careful resets, overhead can consume 40 percent of a shift. Task card design and reset tooling (marked object regions, reset jigs) pull that down more than exhortation ever will.

QA rejection runs 20 to 30 percent on a new task or rig and 10 to 15 percent in a mature pipeline. Sync skew between the 50 Hz action log and 30 fps cameras is the top rejection reason we see, followed by hesitant trajectories and failed completions. Rejection discovered at training time, weeks after collection, is pure loss; rejection at ingest is a correctable signal.

The Three Levers That Move the Number

Scaling teleoperation data collection means attacking retention, ergonomics, and ingest QA, in that order.

Lever Typical gain Cost to implement
Operator retention and certification program Sustains 25 to 40 eps/hr vs repeated novice resets Low: pay, scheduling, progression path
Rig and task ergonomics (leader-follower feel, reset jigs) 20 to 40 percent throughput on contact-rich tasks Medium: GELLO-class leaders ~$300/arm, jig fabrication
Automated QA at ingest (sync, smoothness, completion gates) Recovers the 10 to 30 percent otherwise lost silently Medium: one engineer-month, then near-zero marginal

A note on hardware, since teams often reach for it first. Moving from a $500 VR setup to a $20k ALOHA-class station improves fidelity on fine manipulation, and the original ACT results (80 to 90 percent success from about 50 demos, arxiv.org/abs/2304.13705) show what a well-matched rig enables. But hardware does not fix churn, and it does not fix silent QA loss. We have seen $300 GELLO leaders outproduce premium stations purely because the operators stayed.

A Worked Example: Sizing a 25,000-Episode Program

Program sizing is the exercise of converting an episode target into stations, headcount, and calendar time, with ramp and rejection built in rather than bolted on. Here is the arithmetic for a representative target of 25,000 QA-passed episodes in one quarter.

Start from the end. With a 15 percent rejection buffer, 25,000 passed episodes means collecting about 29,400. A trained operator averaging 30 usable episodes per hour, working six productive hours per shift, yields 180 episodes per day. Naively that is 164 operator-days, or three operators for the quarter. The naive answer is wrong in three ways.

First, ramp. If all three operators start as novices at 10 episodes per hour, the first three weeks produce a third of plan, which costs you roughly 5,000 episodes against the target. Either hire ahead of need or extend the calendar. Second, absence and churn. Floors run at 80 to 90 percent of rostered capacity over a quarter; one resignation among three operators is a 33 percent capacity event plus a new ramp curve. Third, task mix. Contact-rich bimanual tasks run at the bottom of the throughput range, and new tasks spike rejection to 20 to 30 percent for their first two weeks regardless of operator skill.

The sizing that actually holds: five operators across three stations (stations can run staggered shifts), a certification cohort starting two weeks before production, and a rejection buffer that starts at 25 percent for week one of each new task and decays to 15 percent. At $28 to $60 per all-in operator hour, the labor line for the quarter lands between roughly $27k and $70k depending on region and task complexity. That is the honest shape of the bottleneck: not impossible, just physical.

What This Means for Your Roadmap

The practical conclusion is that demonstration data needs the same planning rigor as compute. If your model roadmap says “100k episodes by Q2,” the collection plan behind it should specify stations, operator headcount with ramp assumptions, a rejection buffer of at least 15 percent, and an ingest QA gate that runs nightly. Teams that treat collection as an afterthought discover the bottleneck at the worst possible time: after the training cluster is reserved.

The full playbook, including rig selection tables and per-episode cost math, is in our complete guide to teleoperation data collection.

Next Step

Ready to scope your data program? Talk to our team.

Frequently Asked Questions

Why is teleoperation data the bottleneck in physical AI?

Because action-labeled interaction data cannot be scraped from the web; it must be produced by human operators at 25 to 40 usable episodes per hour at best. Model capacity and compute scale far faster than human demonstration throughput.

Our benchmarks: 8 to 12 usable episodes per hour for a novice, rising to 25 to 40 after two to three weeks of ramp. Contact-rich bimanual tasks sit at the low end, simple pick-place at the high end.

Multi-task training typically needs thousands of episodes per skill family. For reference, Open X-Embodiment pooled over one million trajectories from 22 embodiments, and single-task ACT policies can succeed with about 50 clean demonstrations.

Expect 20 to 30 percent rejection on new tasks or rigs and 10 to 15 percent in a mature pipeline. The top causes are timestamp skew between streams, dropped frames, and failed task completions.

Not yet for contact-rich manipulation. Simulation supplements real data and helps with evaluation, but sim-to-real gaps in contact dynamics and perception mean most production policies still train primarily on real teleoperated demonstrations.

Teleoperation Data Collection for Robot Learning: The Complete 2026 Guide

Midway through a humanoid data program last year, our cost per usable episode rose almost 40 percent in a single week, and for two days nobody could explain it. Every rig passed its health checks. The QA gates were green. The answer had nothing to do with hardware or pipelines: two trained operators had left, their replacements were producing at novice rates, and the ramp math did the rest. Papers make demonstration collection look like a solved problem. In production, it is a staffing, hardware, and QA operation that most ML teams have never run before.

That week is this guide in miniature, and it carries the thesis the whole page argues: teleoperation data collection is an industrial operation, not an ML task, and it succeeds or fails on operational levers. It is part hardware engineering (leader arms, cameras, time sync), part human operations (hiring, training, and retaining operators), and part data engineering (formats, QA, versioning). Underestimate any one leg and the dataset comes out late, expensive, or unusable.

This guide covers the full stack: what teleoperation data collection actually is, the five main rig approaches and what they cost, the economics of operator labor, how demonstrations turn into trained policies, and the QA thresholds that separate usable datasets from expensive noise. The numbers on operator throughput, cost per hour, and rejection rates come from our own collection floors; the hardware and algorithm claims come from the primary literature (ALOHA, GELLO, UMI, DROID, Open-TeleVision), cited throughout.

TL;DR – Teleoperation data collection is the process of recording synchronized robot actions and sensor observations while a human remotely controls the robot through a task, producing demonstrations for imitation learning. – Five rig families dominate: leader-follower arms (ALOHA, ~$20k bimanual), low-cost kinematic leaders (GELLO, roughly $300 per arm), VR controllers/headsets (Quest 3, Vision Pro), 6-DoF desktop devices (SpaceMouse), and robot-free handheld capture (UMI). – Realistic all-in operator cost runs $28 to $60 per teleop hour. Novice operators produce 8 to 12 usable episodes per hour; trained operators reach 25 to 40 within two to three weeks. – Expect 10 to 30 percent QA rejection. Budget for it up front or your episode targets will slip. – 50 clean demonstrations trained with ACT reached 80 to 90 percent success on fine bimanual tasks in the original ALOHA work. Quality compounds; volume alone does not.

What Is Teleoperation Data Collection?

Teleoperation data collection is the process of recording a robot’s proprioceptive states, actions, and camera observations while a human operator remotely controls the robot through a task, producing time-aligned demonstration episodes used to train imitation learning policies. Each episode is a synchronized log: joint positions and velocities, commanded actions, gripper state, and multiple camera streams, typically stored in HDF5 or the LeRobot dataset format (github.com/huggingface/lerobot).

The entity chain matters for anyone mapping this space. Teleoperation produces demonstrations. Demonstrations feed imitation learning algorithms such as ACT (Action Chunking with Transformers, arxiv.org/abs/2304.13705) and Diffusion Policy (arxiv.org/abs/2303.04137). Those policies, scaled across tasks and embodiments, become the training substrate for vision-language-action (VLA) models. Open X-Embodiment aggregated over one million trajectories across 22 robot embodiments largely from teleoperated sources (arxiv.org/abs/2310.08864). No teleop data, no VLA.

A useful mental model: a teleop episode is worth exactly as much as its worst-synchronized stream. A 50 Hz action log paired with a camera that drifted 80 ms out of alignment teaches the policy that objects move before the hand does. That single failure mode wastes more training budget than any other we see.

Core Concepts and Data Modalities

A teleoperation dataset is defined by four things: the action space, the observation streams, the control and capture rates, and the episode structure. Get these right before collecting a single demo, because retrofitting a format after 10,000 episodes is miserable.

Action Space and Leader-Follower Mapping

Leader-follower joint mapping is the control scheme in which a human moves a small “leader” arm and a “follower” robot arm mirrors those joint positions in real time. ALOHA uses this directly: two WidowX-class leader arms drive two ViperX 300 followers, joint to joint, which gives operators immediate kinesthetic intuition and avoids inverse kinematics singularities (arxiv.org/abs/2304.13705). GELLO takes the same idea and rebuilds the leader from hobby-grade Dynamixel servos and printed parts for roughly $300 per arm (arxiv.org/abs/2309.13037). VR and SpaceMouse rigs instead command end-effector poses and rely on an IK solver, which is cheaper but introduces its own artifacts near joint limits.

Observation Streams: Mono, Stereo, Wrist, and Overhead

Observation streams are the camera and sensor feeds recorded alongside actions, and their placement determines what the policy can actually learn. The standard manipulation setup is one or two exocentric (scene) cameras plus one wrist camera per arm. Stereo pairs or depth add geometric grounding for tasks with occlusion. Our default rig records three RGB streams at 640×480, 30 fps, plus joint states at the control rate. Egocentric head cameras matter for humanoid teleop, where systems like Open-TeleVision stream an actively controlled head view into the operator’s headset (arxiv.org/abs/2407.01512).

Control Rate vs Camera Rate: The 50 Hz / 30 fps Problem

The rate mismatch problem is the timing gap created when actions are logged at 50 Hz but cameras capture at 30 fps, leaving no camera frame for two out of every five action steps. ACT-style pipelines handle this by training on the nearest or interpolated frame and predicting action chunks (sequences of 50 to 100 future actions) rather than single steps, which smooths over per-step jitter. What the algorithm cannot fix is unsynchronized clocks. Hardware-timestamp every stream at the source, log in one process or use a shared monotonic clock, and record the offsets. In our QA pipeline, any episode with inter-stream skew above 33 ms (one camera frame) is auto-flagged, and it is the single most common rejection reason on new rigs.

Episode Structure and Task Definition

An episode is one complete attempt at a defined task, from a randomized initial state to a labeled terminal state. Discipline here is what makes a dataset trainable: written task cards, explicit reset procedures, randomized object poses within a marked region, and a per-episode success label assigned at collection time. Datasets that skip initial-state randomization produce policies that memorize a table layout instead of learning a skill.

The Five Rig Approaches Compared

Rig choice is the decision that fixes your cost floor, your data quality ceiling, and which tasks you can collect at all. There is no universal winner; there is a right answer per task family and budget.

Approach Example system Hardware cost Control fidelity Operator ramp Best for Weakness
Bimanual leader-follower ALOHA (Stanford) ~$20k; Mobile ALOHA ~$32k with base Joint-level, 50 Hz, kinesthetic Fast (days) Fine bimanual manipulation Cost per station; fixed embodiment
Low-cost kinematic leader GELLO ~$300 per leader arm + robot Joint-level, high Fast Scaling stations cheaply on arms you own Build/maintenance effort; per-robot tuning
VR headset + controllers Quest 3 rigs; Open-TeleVision style $500 to $3,500 + robot Pose-level via IK, medium-high Medium (1 to 2 weeks) Humanoids, mobile manipulation, immersive tasks IK artifacts, some operator fatigue/sim sickness
6-DoF desktop device 3Dconnexion SpaceMouse $150 to $450 + robot Pose-level, low-medium Slow for contact-rich work Simple pick-place, lab prototyping Slow, unintuitive for dexterous or bimanual tasks
Robot-free handheld UMI gripper Under $1,500 per device Demonstrations without a robot Fast In-the-wild diversity, pre-robot data Embodiment gap; SLAM-dependent pose quality

Three field notes that the spec sheets miss. First, DROID, one of the largest open manipulation datasets (76,000 episodes, 350 hours, 564 scenes), was collected with a Meta Quest 2 controller driving a Franka arm, proof that consumer VR hardware scales to serious datasets (arxiv.org/abs/2403.12945). Second, GELLO is the highest-throughput-per-dollar option if you already own the follower arms, but plan for a part-time technician; printed leaders drift and servos strip. Third, UMI (arxiv.org/abs/2402.10329) is the only approach that collects before your robot ships, which makes it a strong hedge for teams still finalizing hardware.

For a deeper head-to-head, see our companion piece on comparing teleoperation approaches.

Economics: What Teleoperation Data Actually Costs

The true cost of teleoperation data is operator hours multiplied by an all-in rate, divided by usable episode yield, and most budgets get all three numbers wrong. Hardware is the smaller line item; a $20k ALOHA station running two shifts amortizes to under $3 per collection hour over a year. Labor and QA dominate.

Our first-hand benchmarks, consistent across programs we run:

Cost and throughput factor Typical range (our benchmarks)
All-in operator cost (wages, supervision, facility, hardware amortization) $28 to $60 per teleop hour
Novice operator throughput (weeks 1 to 2) 8 to 12 usable episodes per hour
Trained operator throughput (week 3 onward) 25 to 40 usable episodes per hour
QA rejection rate (mature pipeline) 10 to 15 percent
QA rejection rate (new task or new rig, first 2 weeks) 20 to 30 percent
Effective cost per usable episode roughly $0.90 to $6.00 depending on task complexity

Two implications fall out of that table. The operator ramp curve is a 3x throughput difference, so operator retention is a data-cost lever bigger than any hardware decision; churn resets you to novice yield. And QA rejection compounds against you: a 10,000-episode target with 25 percent rejection means collecting 13,300, not 10,000. We cover the bottleneck math in detail in why teleoperation data is the bottleneck in physical AI.

ROI framing for buyers: at $40 per hour all-in and 30 usable episodes per hour, a 50,000-episode dataset costs about $67k in collection labor before QA overhead. Compare that against three to six months of two ML engineers building and debugging an in-house collection operation, and outsourced collection frequently wins on time even when it ties on cost.

From Demonstrations to Policy: The Imitation Learning Pipeline

The imitation learning pipeline is the sequence that converts teleoperated demonstrations into an evaluated robot policy: collect episodes, convert to a training format, train ACT or a diffusion policy, then measure real-world success rate. The pipeline is short; the feedback loop is what teams underuse.

  • Collect and QA. Episodes stream into storage with per-episode metadata (task, operator, rig, success label). QA gates on sync skew, dropped frames, trajectory smoothness, and task success.
  • Convert. HDF5 or ROS 2 bags convert to LeRobot format for training and sharing on Hugging Face.
  • Train. ACT with action chunking (predicting ~100-step action sequences at 50 Hz) or Diffusion Policy for multimodal action distributions.
  • Evaluate. Fixed evaluation protocol: N rollouts per task with randomized initial states, report success rate.
  • Loop. Failure modes from evaluation define next week’s collection priorities.

The proof point worth anchoring on: the original ACT work reached 80 to 90 percent success on fine bimanual tasks such as cable routing and battery insertion from only 50 demonstrations per task (arxiv.org/abs/2304.13705). Demonstration quality and consistency, not raw volume, set that outcome. We have watched 400 sloppy episodes lose to 120 clean ones on the same task, same architecture. Collect less, reject more, retrain sooner.

Case Study Proof: Scaling a VLA Data Program

A humanoid foundation model team came to us needing 12,000 QA-passed bimanual episodes across 40 household tasks in ten weeks, after their in-house effort had produced 1,900 episodes in eight weeks with a 34 percent rejection rate. We stood up six leader-follower stations, ran a two-week operator certification program, and enforced automated sync and smoothness gates at ingest. By week four the floor was producing 1,400 usable episodes per week; the program closed at 12,600 QA-passed episodes with a 12 percent final rejection rate, and the team’s ACT baseline improved from 41 to 68 percent average task success on their internal eval. The full breakdown, including what failed in weeks one and two, is in the VLA case study.

Standing Up a Collection Program: The First 30 Days

A collection program launch is a 30-day sequence of hardware bring-up, protocol authoring, operator certification, and QA gate activation, in that order. Teams that compress or reorder it pay the cost back with interest in weeks five through eight. Our standard sequence:

Days 1 to 7: rigs and clocks. Assemble stations, calibrate cameras (record intrinsics and extrinsics per rig, per calibration), and prove time sync before anyone collects a demonstration. Log a physical sync event (a clapboard works) and verify every stream lands within one camera frame. A day spent here saves a re-collection later; skew discovered after 5,000 episodes is not fixable in post.

Days 8 to 14: protocol. Write task cards for the first five tasks: success criteria, reset procedure, randomization zones marked physically on the workspace, and expected episode duration. Pilot each card yourself before an operator touches it. Every ambiguity you leave in a task card becomes a labeling inconsistency in the dataset.

Days 15 to 28: certification. Run operators through reference tasks with a throughput bar (we use 20 usable episodes per hour) and a quality bar (QA pass rate above 80 percent) before production collection begins. Expect the standard ramp: 8 to 12 usable episodes per hour early, 25 to 40 after two to three weeks.

Day 30: gates on. Nightly automated QA becomes mandatory, with per-operator, per-rig reports every morning. From this point, the program self-corrects.

Build vs Buy: The Honest Decision Criteria

The build-versus-buy question comes down to whether demonstration collection is a competency your team needs to own or a supply problem it needs solved. Building makes sense in three cases: your embodiment is unusual enough that no vendor has matching rigs, your data requirements are small (under roughly 5,000 episodes), or collection know-how is itself part of your product thesis. Buying makes sense when the deadline is the constraint. The math from the economics section applies either way, but in-house programs carry two costs that rarely appear in the comparison spreadsheet: the two to four engineer-months of pipeline and QA tooling before the first reliable episode, and the management overhead of running an operations floor inside an ML organization. We are a vendor, so discount our view accordingly; then ask any team that has run both models which cost they underestimated.

Free Resource: Teleoperation Data RFP Scorecard

A vendor RFP scorecard is a weighted rubric for comparing teleoperation data providers on the criteria that actually predict dataset quality. Ours scores ten dimensions, including sync guarantees, QA rejection transparency, operator training programs, format deliverables, and per-episode pricing disclosure. Most vendors will not publish cost per hour; make them fill in the sheet. [Download the RFP scorecard (XLSX)] and use it on us too.

Related reading: 5 hidden challenges in teleoperation data collection.

Next Step

If you are scoping a demonstration data program, two options. Download 10 free teleoperation episodes (HDF5 plus synchronized MP4, three camera views, 50 Hz actions) and run them through your training stack. Or book a 30-minute scoping call with our data operations team and leave with a per-episode cost estimate for your task list. [Download Sample Data] | [Book a Demo]

Frequently Asked Questions

What is teleoperation data collection?

Teleoperation data collection is the recording of synchronized robot actions, joint states, and camera observations while a human operator remotely controls the robot through a task. The resulting episodes train imitation learning policies such as ACT and diffusion policies, which underpin VLA models.

Our all-in benchmark is $28 to $60 per operator hour, covering wages, supervision, facility, and hardware amortization. With trained operators producing 25 to 40 usable episodes per hour, effective cost lands between roughly $0.90 and $6.00 per usable episode depending on task complexity.

Fewer than most teams assume, if quality is high. The original ALOHA/ACT results reached 80 to 90 percent success on fine bimanual tasks with about 50 demonstrations per task. Multi-task and VLA training raises the requirement into the thousands per skill family, which is where collection economics start to dominate.

It depends on the task family and budget, per the comparison table above. Fine bimanual manipulation favors leader-follower rigs (ALOHA at ~$20k, or GELLO leaders at ~$300 per arm on robots you own). Humanoid and mobile tasks favor VR teleop. Robot-free UMI capture wins when hardware has not shipped yet.

The main causes are inter-stream time skew above one camera frame, dropped frames, jerky or hesitant trajectories, failed task completions, and reset protocol violations. Expect 20 to 30 percent rejection in the first two weeks on a new task and 10 to 15 percent once the pipeline matures.

Yes. UMI-style handheld grippers record demonstrations with a wrist-mounted camera and SLAM-derived poses, no robot required. The trade-off is an embodiment gap when transferring to your platform, so most teams use it to supplement, not replace, on-robot teleop.

HDF5 per episode and the LeRobot dataset format are the current de facto standards; ROS 2 bags are common at capture time. Whatever the container, require hardware timestamps on every stream and per-episode metadata (task, operator ID, rig ID, success label).