Dexset

5 Hidden Challenges in Training Data for Vision-Language-Action (VLA) Models and How to Solve Them

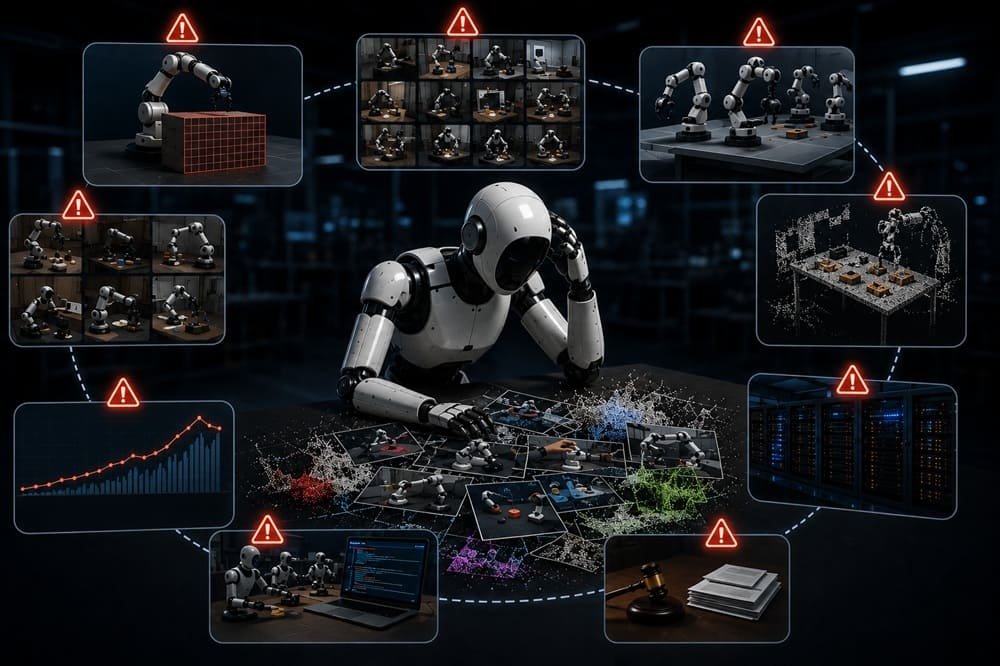
Spot-checking your robot dataset is making things worse. Not the data, your judgment of it: per-episode visual review manufactures confidence, while the defects that actually sink VLA fine-tunes live at the distribution level, where no individual episode looks wrong. That is the thesis of this post, and its practical consequence: the unit of QA for VLA data is the batch and the corpus, not the episode.

The obvious VLA training data quality problems get solved early because they are loud. Not enough episodes, missing camera streams, no language labels: these announce themselves in week one. The problems that actually sink fine-tunes are quiet. They pass a visual spot-check, survive ingestion without errors, and only surface weeks later as a loss curve that plateaus early or a policy that fumbles tasks it should own.

These failures stay hidden for a structural reason. A robot dataset has no compiler. Nothing throws an exception when your timestamps drift 40 ms or when 92% of your instructions share one sentence shape. The data trains. The model just trains worse, and the gap gets attributed to architecture, hyperparameters, or “needing more data,” which leads teams to buy more of the same defective distribution.

We gate every dataset that leaves DexSet through a QA pipeline built around these exact failure modes, so this post is written from the reject pile. For each of the five challenges: what it is, how it hides, how it damages training, and the check that catches it. All five checks are runnable before you spend a single GPU-hour.

Key Takeaways – The five quiet VLA training data quality failures: frame-action timestamp skew, instruction monoculture, silent failure episodes, embodiment/config drift, and mixture starvation. – Each one passes casual inspection and each one measurably degrades fine-tunes; contamination rates as low as 5-10% flatten gains on precision tasks in our ablations. – Every one has a cheap automated check; together they cost $5-9 per data-hour in our pipeline, a fraction of the GPU spend they protect. – Diversity metrics belong in acceptance criteria, not in hopes: template share, verb counts, and per-task hour caps should be contractual.

Challenge 1: Frame-Action Timestamp Skew

Timestamp skew is a systematic offset or drift between when a camera frame was captured and when the recorded action actually executed. Software timestamps on separate device clocks drift, USB cameras buffer unpredictably, and a rig that was aligned in January is often 30-50 ms off by March.

Why it hides: video looks fine, actions replay fine, and nothing is corrupt. Why it hurts: modern VLAs predict action chunks, and continuous-action heads (diffusion in Octo, arxiv.org/abs/2405.12213; flow matching in pi-zero, arxiv.org/abs/2410.24164) regress targets whose alignment with observations is the whole training signal. Skew smears that mapping. In our fine-tune ablations, loss curves separate measurably once skew passes about 10 ms, which is where we set our rig tolerance.

The fix: hardware timestamping where possible, a physical sync event at episode start (a visible gripper snap works), and an automated cross-correlation check between commanded motion and observed motion per episode. Reject on drift, do not average it away.

Challenge 2: Instruction Monoculture

Instruction monoculture is a label distribution where most episodes share a handful of sentence templates, regardless of how many total instructions exist. A 100,000-episode corpus with 14 templates is monoculture at scale; we audited exactly that situation in a recent humanoid client engagement.

Why it hides: ataset cards report episode counts, not instruction diversity – the metric that actually predicts language generalization. Why it hurts: the model learns the templates as fixed keys rather than learning language. RT-1-era templated labels produced policies with a vocabulary of about a dozen verbs (arxiv.org/abs/2212.06817); the semantic breadth in RT-2 came from web co-training, not from the robot labels (arxiv.org/abs/2307.15818). If your labels are monoculture, paraphrase failure is guaranteed.

The fix: measure template share, unique verbs, and spatial-relation coverage per batch, and set hard thresholds. We cap any single template at 8% of a batch and run paraphrase augmentation on failures. Priced honestly, a proper natural-language annotation pass adds $8-15 per data-hour. It is the least skippable line in the budget.

Challenge 3: Silent Failure Episodes

A silent failure episode is a demonstration where the task did not actually succeed – the most damaging robot dataset QA gap in teleoperation-based collection but the episode carries no failure label, so it trains the policy on a wrong outcome presented as a right one. teleoperators drop objects, miss insertions by a few millimeters, or complete the wrong variant – which is why teleoperation data collection requires explicit success criteria baked into the session protocol of an ambiguous task, and at collection pace nobody logs it.

Why it hides: failures look like successes at thumbnail resolution, and per-episode review feels too expensive so teams sample 2% and hope. Why it hurts: imitation learning has no mechanism to discount bad demonstrations; a 5-10% contamination rate is enough to visibly flatten fine-tune gains on precision tasks in our ablations.

The fix: explicit success criteria written per task family before collection, a success label as a required field, and dual review on a stratified sample weighted toward long-horizon and precision tasks. This is most of what our $5-9 per data-hour teleoperation data quality review buys.

Challenge 4: Embodiment and Configuration Drift

Configuration drift is unannounced variation in the physical setup across a collection: cameras nudged between sessions, gripper fingers swapped after wear, firmware updates that change controller latency, tables raised two centimeters. Each change is small. Accumulated, your “single embodiment” corpus is quietly five embodiments.

Why it hides: no single episode is wrong, so episode-level QA passes everything. Why it hurts: the policy either averages across configurations it cannot distinguish or keys on incidental visual cues to tell them apart. Cross-embodiment training works when variation is labeled, which is exactly how Open X-Embodiment makes 22 embodiments useful (arxiv.org/abs/2310.08864); unlabeled variation is just noise.

The fix: a per-session calibration ritual (camera extrinsics check, gripper state, controller version logged into episode metadata) and drift detection that compares session-level statistics. Metadata is free at collection time and unrecoverable afterward.

Challenge 5: Mixture Starvation

Mixture starvation is a training mixture where one data source or task family dominates sampling, starving the components that were the reason you built the mixture. It happens by accident: datasets differ in episode length, so uniform episode sampling silently overweights short-episode sources.

Why it hides: the mixture config looks balanced on paper while the effective batch composition is not. Why it hurts: OpenVLA and Octo both hand-tuned per-dataset mixture weights rather than sampling naively, and OpenVLA’s curated 970k-episode mixture is a large part of how a 7B model beat a 55B one (arxiv.org/abs/2406.09246). Teams that skip mixture sampling accounting also routinely drop web co-training too low and watch open-vocabulary grounding decay.

The fix: account mixtures in timesteps or tokens, not episodes; log effective composition per training run; cap per-task-family hours at collection time so the raw corpus starts balanced (we use a 60-hour cap per family in typical fine-tuning collections).

A note on why these five cluster together: they are all distribution problems rather than instance problems. Any single episode can pass inspection while the corpus as a whole is defective, which is why per-episode spot checks feel reassuring and prove nothing. The unit of QA for VLA data is the batch and the corpus. Once a team internalizes that, the checks below stop looking like overhead and start looking like the cheapest model improvement available.

How Do You Check VLA Training Data Quality? (5 Checks)

ChallengeCheap Detection CheckThreshold We Use
Timestamp skewCommand-vs-observed motion cross-correlation per episodeReject > 10 ms
Instruction monocultureTemplate share + unique-verb count per 1,000-episode batchNo template > 8%
Silent failuresSuccess criteria + stratified dual review5% dual-review floor
Configuration driftSession metadata + session-statistics comparisonAny unlogged change fails
Mixture starvationTimestep-level composition logging per runMatch declared weights ±5%

Run these against any dataset, ours included, before training on it. The full framework, including costs and the vendor RFP scorecard these checks feed into, is in the complete guide to VLA training data.

Next Step

download our free LeRobot-format sample pack and run these five checks against it yourself; the QA report ships alongside the episodes. Or start with the complete VLA training data guide.

Frequently Asked Questions

What are the most common quality problems in VLA training data?

The quiet ones: frame-action timestamp skew, instruction template monoculture, unlabeled failure episodes, unlogged configuration drift, and unbalanced training mixtures. All five pass casual inspection and all five measurably degrade fine-tunes.

For continuous-action models we hold frame-to-action skew under 10 ms, because our fine-tune ablations show measurable degradation beyond that. Discrete-token models tolerate more, but skew is cheap to control at capture time and expensive to fix later.

Measure instruction template share and unique-verb counts per batch, verify success labels on a stratified dual-reviewed sample, and cross-correlate commanded against observed motion for sync. All three checks run in hours on commodity hardware.

Usually because the new data repeats the old distribution: same tasks, same templates, same scene. Past roughly 50-150 demonstrations per task, marginal episodes add little; audit diversity before adding volume. This is the most common symptom of undetected VLA training data quality problems in the distribution.
Case Study: How We Scaled VLA Training Data for a Humanoid Foundation Model Team

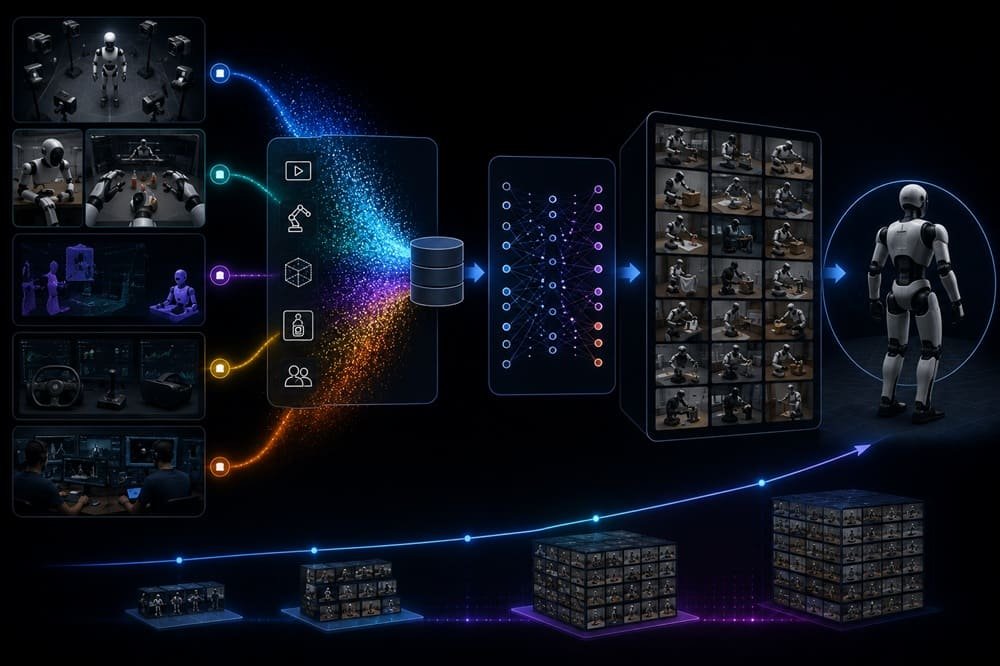
On station four of the collection floor, an operator sets down her leader arms after a clean bowl-to-sink transfer, and the batch dashboard flags the episode anyway. The instruction field reads “put the bowl in the sink,” the same sentence shape as two hundred episodes before it, and the template-share gate has just tripped. That flag, firing in the middle of a live program, is the single most important control in the engagement this post describes.

The client behind that program, a humanoid foundation model team, did not come to us asking for data. They came asking why their model was failing. Their OpenVLA-style fine-tune scored well on standard tabletop evaluations, then collapsed on the bimanual kitchen tasks their product actually needed. Worse, the policy only responded reliably to instructions phrased exactly like the training labels. “Put the bowl in the sink” worked. “Move that bowl into the sink” mostly did not.

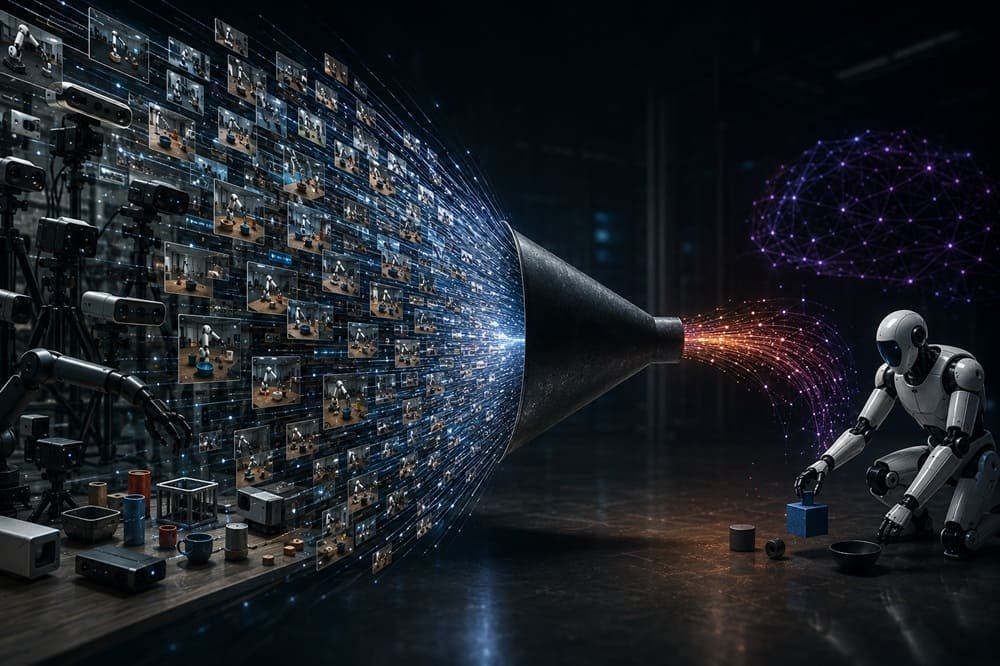
The failure had a clean explanation in their data, and it is the most common one we see. Their existing corpus was large by episode count, roughly three times what we ended up collecting, but it covered only 9 task families and used 14 instruction templates. The model had learned those 9 tasks and those 14 sentence shapes, thoroughly, and almost nothing else. Volume was never the problem. Distribution was.

This post walks through what we scoped, what the QA gates caught, what it cost in structure (with our standard benchmark rates), and what changed in their evaluations. If you are planning a fine-tuning collection, the transferable part is the method: diversity targets set as hard gates, not aspirations.

Key Takeaways – 1,400 hours of bimanual teleoperation across 42 task families replaced a corpus 3x larger in episode count but 5x narrower in tasks. – A hard instruction diversity gate (no template above 8% of any batch) fixed paraphrase brittleness; language annotation ran at our standard $12-15 per data-hour, segment-level. – Blending new data 60/40 with the legacy corpus roughly doubled held-out kitchen task success in the client’s own evaluation harness. – QA rejected 11% of collected episodes; the top three causes were teleoperator mid-chunk pauses, frame-action sync drift, and failed-but-unlabeled episodes. – Total program ran 19 weeks from scoping to final delivery in LeRobot-compatible format.

The Starting Point: A Large but Narrow Corpus

A narrow corpus is a dataset whose episode count outruns its task, scene, and language diversity, and it trains models that look strong on in-distribution tests and brittle everywhere else. The client’s legacy data was a textbook case: high volume, 9 task families, 14 templates, single kitchen scene, one camera geometry.

The published evidence already pointed to the fix. Open X-Embodiment showed pooled diversity beating single-domain volume (arxiv.org/abs/2310.08864), and Mobile ALOHA reached strong per-task results co-training with roughly 50 demonstrations per task over a broad base (arxiv.org/abs/2401.02117). Our job was to apply that at commercial fine-tuning scale on their embodiment, where cross-embodiment transfer is weakest.

What We Scoped

The collection specification is the deliverable that matters most, so we fixed it before a single episode was recorded:

  • Volume and spread: 1,400 robot-hours of bimanual teleoperation across 42 task families, capped at 60 hours per family to force breadth.
  • Scenes and objects: 6 kitchen layouts, 300+ object instances, mandated lighting variation across sessions.
  • Capture spec: 4 camera streams per station (two exocentric, head, wrist), 30 Hz, hardware-timestamped, frame-to-action skew held under 10 ms.
  • Language spec: natural free-form instructions written at collection time, segment-level labels with timestamps on all long-horizon episodes, and the diversity gate below.
  • Format: LeRobot-compatible episodes so their training stack ingested data on day one (github.com/huggingface/lerobot).

The Instruction Diversity Gate

An instruction diversity gate is a batch-level QA rule that rejects any 1,000-episode batch where a single instruction template exceeds a set share, in this case 8%. Annotators drift toward comfortable phrasings; without a gate, “pick up the X and place it in the Y” quietly becomes half your labels.

We enforced three thresholds per batch: template share under 8%, minimum unique verb count, and minimum spatial-relation phrase coverage (“behind the cutting board”, “second shelf from the top”). Batches that failed went back for paraphrase augmentation before delivery. This is also where the money went: segment-level annotation with paraphrase passes ran at our standard $12-15 per data-hour, versus $8-10 for a plain episode-level pass. The client initially pushed back on that line item. It ended up being the line item their evaluation results vindicated most directly.

How the Program Ran

A collection program’s timeline is set by station-hours and reset speed, not by calendar ambition, so we planned backwards from throughput. The program ran 19 weeks across six bimanual stations: two weeks of scoping and task-family design with the client’s ML team, one week of operator training and pilot batches, fourteen weeks of production collection, and two weeks of final QA, re-collection of rejected hours, and packaging.

The pilot week matters more than its size suggests. We shipped the first 40 hours to the client immediately and they ran a smoke-test fine-tune before full production started. That surfaced two spec problems while they were still cheap to fix: their training stack expected a different gripper action convention, and one camera’s mounting height put the left workspace edge out of frame on tall-object tasks. Catching either in week twelve instead of week three would have cost hundreds of re-collected hours. If a vendor does not offer a pilot-batch gate before full-rate production, build one into the contract yourself.

Weekly deliveries went out in LeRobot format with per-batch QA reports, so the client’s dataset grew continuously instead of arriving as one end-of-program surprise.

What QA Caught

Episode rejection is the health metric of a collection program, and ours ran at 11% across the engagement. Where those episodes died:

Rejection CauseShare of RejectsWhy It Matters for VLA Training
Teleoperator mid-chunk pauses34%Corrupts action-chunk targets for chunked policies (ACT-style and continuous heads)
Frame-action sync drift > 10 ms27%Measurably degrades continuous-action fine-tunes
Failed episode, unlabeled22%Success mislabeling flattens gains on precision tasks
Dropped frames / camera faults11%Breaks observation continuity
Instruction-episode mismatch6%Directly poisons language conditioning

Every rejected hour was recollected within the fixed budget because our per-hour rates ($40-60 for bimanual leader-follower work, our standard benchmark range) price in an expected rejection band. If a vendor quotes you a rate with no stated rejection policy, that risk is sitting on your side of the table.

Results

The client fine-tuned on the new corpus blended 60/40 with their legacy data and ran their internal evaluation harness before and after. Directional results, their harness, not an audited benchmark:

  • Held-out kitchen task success roughly doubled against the legacy-data baseline.
  • Paraphrased-instruction success moved from near-random to parity with template phrasing.
  • Long-horizon task completion improved most on tasks with segment-level labels, consistent with what the pi-zero pipeline reports about post-training data quality (arxiv.org/abs/2410.24164).

The result we quote most often is the second one, because it isolates the language layer. Nothing about the model changed. The labels changed.

What Transfers to Your Program

Four rules from this engagement apply to almost any VLA fine-tuning collection:

  • Audit distribution before buying volume; count task families and unique templates in your existing corpus first.
  • Set diversity thresholds as batch-level rejection gates, not guidelines.
  • Price annotation and QA as separate line items so you can see what you are cutting when you cut.
  • Cap hours per task family; the marginal episode of a covered task is your most overpriced purchase.

The full scoping framework, cost tables, and the RFP scorecard we build these programs from are in the complete guide to VLA training data.

Next Step

if your evaluations look like this client’s before-picture, book a scoping call. We will audit your corpus distribution before recommending a single collection hour, or start with the complete VLA training data guide.

Frequently Asked Questions

How many hours of data does it take to fine-tune a VLA for a humanoid?

This program used 1,400 hours across 42 task families, blended with existing data. Humanoids sit at the expensive end because cross-embodiment transfer from open datasets is weakest for them; standard single arms often need only 200-500 hours.

A batch-level QA rule that rejects annotation batches where any single instruction template exceeds a set share (we used 8%), with minimum thresholds for unique verbs and spatial-relation phrases. It prevents the label monoculture that makes VLA policies brittle to paraphrasing.

The legacy data still carried valid task knowledge; the 60/40 blend kept that signal while the new data corrected the distribution. Full replacement wastes paid-for coverage and can regress previously working tasks.

We ran 11% on this program, and 10-15% is the band we consider healthy for bimanual long-horizon work. A vendor reporting near-zero rejection is usually not checking sync, pauses, or success labels.

Why Training Data for Vision-Language-Action (VLA) Models Is the Biggest Bottleneck in Physical AI

Somewhere on every VLA data plan sits a line that reads “annotation and QA,” and it is the checklist item nearly everyone skips when the budget gets real. Collection hours get scoped to the dollar. GPU spend gets scoped to the node. The layers that decide whether those hours train anything get a checkbox. That skipped line is usually where we find the explanation when a team arrives with a Prismatic-style backbone, sensible action head, clean training code, and a model that still cannot pick up a mug it has never seen when the instruction is phrased slightly differently.

The deeper reason is structural, not a bug. Language models got to scrape a web that humanity spent thirty years writing. VLA models need trajectories where a physical robot moved and every action was recorded, and that data did not exist until someone paid to create it, one teleoperated episode at a time. Open X-Embodiment, the largest pooled open corpus, holds just over one million trajectories from 22 embodiments (arxiv.org/abs/2310.08864). Web-scale image-text corpora hold billions of pairs. Physical AI is trying to reach foundation-model behavior on roughly one-thousandth of the data its sibling fields consider table stakes.

This post argues one thesis: the VLA data bottleneck is not a single constraint but a four-layer stack (collection throughput, action-label fidelity, language annotation, QA), and teams that budget only for the first layer buy datasets that train worse models than their size suggests. We show where each layer binds, what it costs to push against, and which strategies the leading labs use to spend around it efficiently. We collect and QA this data for a living at DexSet, so the cost numbers are our own production benchmarks, flagged as such.

Key Takeaways – The robot data gap is around three orders of magnitude versus web vision-language corpora, and it cannot be closed by scraping. – The bottleneck has four layers: collection throughput, action-label fidelity, language annotation quality, and QA. Most teams only budget for the first. – RT-1 took 17 months and 13 robots to produce ~130k episodes; that throughput ceiling is why teleoperation economics matter. – In our benchmarks, usable teleop data costs $28-60 per robot-hour to collect, plus $8-15 per hour for language annotation and $5-9 for QA. – The efficient escape routes are cross-embodiment pretraining, web co-training, and spending fresh budget on diversity rather than raw episode count.

What Makes VLA Training Data a Bottleneck?

The VLA data bottleneck is the mismatch between how fast robot demonstration data can be produced and how much of it foundation-model training consumes. Every VLA needs episodes containing synchronized observations, executed actions, and language instructions, and each of those three elements has its own production constraint.

Consider the throughput math. RT-1’s dataset took a fleet of 13 robots 17 months to reach roughly 130k episodes across about 700 tasks (arxiv.org/abs/2212.06817). That is real-world, well-funded, industrial-scale collection, and it averages out to under 20 usable episodes per robot per day once resets, failures, and curation are counted. On our own rigs we see 20-40 usable tabletop episodes per collection hour on a good day, and 8-15 for long-horizon bimanual work. There is no caching layer for the physical world. Every episode costs wall-clock time on hardware.

The Four Layers of the Bottleneck

The bottleneck is a stack of four constraints, and underestimating any one of them produces a dataset that trains a worse model than its size suggests.

1. Collection throughput. Robots and teleoperators produce data in real time. A 10,000-hour corpus, the scale pi-zero reports pretraining on (arxiv.org/abs/2410.24164), is five years of single-rig operation or a coordinated fleet effort. Throughput is bought with parallel stations, trained operators, and fast reset design, all of which show up in cost per hour.

2. Action-label fidelity. Actions are the labels, and they are only as good as your sync. Continuous-action models (flow matching, diffusion heads) train on action chunks, and timestamp skew between frames and commands degrades them measurably. We hold frame-to-action skew under 10 ms on our rigs because our fine-tune ablations show loss curves separating beyond that.

3. Language annotation quality. An episode without a good instruction is imitation data, not VLA data. Templated labels teach a dozen verbs; natural, diverse instructions teach language conditioning. This layer adds $8-15 per data-hour in our pipeline, and skipping it is the single most common false economy we see.

4. QA and success verification. Failed episodes, teleoperator pauses, dropped frames, and mislabeled successes all pollute training. A 5-10% contamination rate is enough to flatten fine-tune gains on precision tasks, which is why QA is a priced line item and not a virtue.

Why You Cannot Scrape Your Way Out

Web video contains no action labels, so it cannot substitute for the action-labeled core of VLA training. Human video (Ego4D-scale corpora, YouTube) shows what manipulation looks like but never records the motor commands that produced it. The field’s answer, formalized in NVIDIA’s GR00T N1 data pyramid (arxiv.org/abs/2503.14734), is to use web and human video as a broad lower layer for visual priors, synthetic data in the middle, and real teleoperation as the small, expensive, indispensable top layer. The pyramid reduces how much teleop you need. It does not remove the layer.

What the Bottleneck Costs, in Numbers

The cost of VLA training data is best expressed per robot-hour with annotation and QA broken out, because bundled per-episode pricing hides where the money goes. Our production benchmarks:

LayerTypical CostFailure Mode If Skipped
Teleop collection (tabletop, VR rig)$28-38 per robot-hourNone; this is the floor
Teleop collection (bimanual, leader-follower)$40-60 per robot-hourUnder-scoped dexterity data
Language annotation (episode-level)$8-10 per data-hourPolicy ignores instructions
Language annotation (segment-level)$12-15 per data-hourNo long-horizon capability
QA + success labels$5-9 per data-hour5-10% contamination, flattened gains

A 2,000-hour fine-tuning corpus, fully annotated and QA’d, lands between roughly $110k and $170k. That number stops feeling large when compared against the GPU spend it protects: a fine-tune run on contaminated or label-poor data burns the same compute and returns a weaker policy.

How Leading Teams Route Around It

The efficient strategies all share one principle: never pay to collect what transfer can give you, and spend fresh budget on what transfer cannot.

  • Start from cross-embodiment pretraining. OpenVLA’s 7B model, pretrained on ~970k OXE episodes, outperformed the 55B RT-2-X on its 29-task evaluation (arxiv.org/abs/2406.09246). The base layer is a solved purchase; open weights exist.
  • Co-train with web vision-language data. RT-2 showed this preserves open-vocabulary semantics (arxiv.org/abs/2307.15818). It costs mixture engineering, not collection dollars.
  • Buy diversity, not depth. Past roughly 50-150 demonstrations per task, marginal episodes decay in value; Mobile ALOHA reached strong task performance co-training with about 50 demos per task (arxiv.org/abs/2401.02117). New tasks, scenes, objects, and phrasings beat episode 400 of a solved task.
  • Match embodiment where it counts. Cross-embodiment transfer is weakest into dexterous hands and humanoids, so reserve embodiment-matched collection for exactly those gaps.

One more route deserves a mention because it is quietly effective: instruction relabeling. DROID and several lab pipelines have used vision-language models to generate or augment instructions on already-collected episodes, which raises language diversity on data you have already paid for. It does not fix bad sync or unlabeled failures, and machine-generated labels need a human QA sample, but as a cost lever it is hard to beat: you are improving the most neglected layer of the stack at annotation prices rather than collection prices.

The common thread in all five strategies is that they treat the bottleneck as a portfolio problem. No single source escapes it. A deliberate stack of open data, web co-training, synthetic coverage, relabeling, and targeted teleoperation gets a team to a working policy at a fraction of the naive all-teleop cost, and every published frontier system is some version of that stack.

We cover the full scoping framework, including the RFP scorecard we make vendors fill out, in our complete guide to VLA training data.

Next Step

if you want to see what clean, sync-verified, language-diverse teleop data looks like before budgeting a collection, download our free LeRobot-format sample pack, or read the full guide first.

Frequently Asked Questions

Why is training data the bottleneck for VLA models instead of compute?

Compute is fungible and rentable; robot demonstrations are produced in real time on physical hardware. The largest open robot corpus holds about one million trajectories, roughly one-thousandth of web vision-language scale, and every additional hour must be physically collected.

Pretrain or start from open cross-embodiment checkpoints (OpenVLA, Octo), co-train with web data to keep semantics, and spend collection budget only on embodiment-matched, task-matched fine-tuning data with diverse language labels. Expect $110k-170k for a fully annotated 2,000-hour corpus at current market rates.

Simulation reduces but does not remove real-data needs. Sim-to-real gaps in contact dynamics and visual realism persist, which is why current pipelines (including GR00T N1) use synthetic data as a middle layer under a real teleoperation layer, not as a replacement.

The imitation-learning literature repeatedly lands around 50-150 demonstrations per task when fine-tuning on top of a broad pretrained base, with more needed for contact-rich or long-horizon tasks. Diversity across tasks and phrasings matters more than pushing any one task far past that floor.

The Complete Guide to Training Data for Vision-Language-Action (VLA) Models (2026)

Five billion image-text pairs sit in LAION-5B (arxiv.org/abs/2210.08402); just over one million robot trajectories sit in Open X-Embodiment, the largest open robot dataset ever assembled (arxiv.org/abs/2310.08864). Those two numbers should not both describe the training diet of a single model family, yet every production VLA pairs a vision-language half fed at web scale with an action half starved at roughly one-thousandth of it. That mismatch, more than any architecture choice, is the defining constraint of physical AI in 2026.

The gap exists because the two halves come from different worlds. The vision-language half was pretrained on image-text pairs that already existed. The action half needs robot trajectories that do not exist until someone physically collects them, frame-synchronized, action-labeled, and paired with language instructions. You cannot scrape your way out of that. Which is why, on most VLA programs, the architecture question gets settled in a week and the compute budget in a month, while the question of how many language-annotated trajectories the model needs, at what task diversity, on which embodiments, goes unanswered the longest.

This guide gives you the full picture: what VLA training data is, how the landmark models (RT-1, RT-2, OpenVLA, Octo, pi-zero, GR00T) actually sourced their data, how action representation changes your labeling requirements, what collection and annotation cost per hour, and how to scope a dataset that transfers to your embodiment instead of overfitting to someone else’s lab. The thesis we argue throughout, and the one our delivery data keeps confirming: once you stand on the open-data base layer, dataset composition (task diversity, instruction diversity, capture fidelity) predicts VLA capability better than episode count, so budget should follow distribution, not volume.

DexSet supplies egocentric, exocentric, teleoperation, mono, and stereo data to robot foundation model teams. The numbers in this guide come from our own rigs, QA pipelines, and cost benchmarks, alongside the primary papers. Where a figure is our internal benchmark rather than a published result, we say so.

TL;DR: Key Takeaways – VLA training data consists of robot trajectories (synchronized camera frames + robot actions) paired with natural-language instructions, usually collected via teleoperation. – Landmark scale points: RT-1 used ~130k episodes over 17 months; OpenVLA pretrained on ~970k episodes from Open X-Embodiment; pi-zero reports on the order of 10,000 hours of dexterous robot data. – Action representation drives labeling spec: discrete action tokens (RT-2, OpenVLA) tolerate lower control rates; continuous-action heads (pi-zero flow matching, Octo diffusion) reward 50 Hz, low-jitter capture. – In our benchmarks, teleoperation collection runs $28-60 per robot-hour depending on rig and task complexity; a proper language annotation pass adds $8-15 per hour of data. – Data mixture beats raw volume: co-training on web-scale vision-language data plus a well-balanced robot mixture is what gives VLAs semantic generalization. – Task and scene diversity predict generalization better than episode count once you pass a per-task floor (roughly 50-150 demonstrations per task in the imitation-learning literature).

What Is Training Data for Vision-Language-Action (VLA) Models?

Training data for VLA models is a corpus of robot demonstration episodes in which each timestep pairs visual observations, robot proprioceptive state, and executed actions, and each episode (or segment) carries a natural-language instruction describing the task. A VLA model consumes images and an instruction as input and produces robot actions as output, so its training data must contain all three aligned in time.

A single well-formed episode contains:

  • Observations. One or more camera streams (wrist-mounted, over-the-shoulder exocentric, or head-mounted egocentric), typically 224×224 to 1080p RGB at 10-60 fps, optionally stereo pairs or depth.
  • Proprioception. Joint positions, gripper state, end-effector pose, usually at the control rate.
  • Actions. The command stream that produced the motion: delta end-effector poses, joint targets, or gripper commands, timestamped against frames.
  • Language. An instruction such as “put the red mug on the top shelf,” attached at episode level, and increasingly at sub-episode segment level for long-horizon tasks.

The entity chain matters for anyone mapping this space: teleoperation rigs (ALOHA-style leader-follower arms, VR controllers, exoskeletons) produce demonstrations; demonstrations feed imitation learning; imitation learning at scale, on top of a pretrained vision-language backbone, is what turns a VLM into a VLA. The Hugging Face LeRobot project has become the de facto open format for storing these episodes, and its dataset cards are a good reference for what a clean schema looks like.

How the Landmark VLA Models Sourced Their Data

Every major VLA result is downstream of a specific, documented data strategy, and the strategies differ more than the architectures do. Reading the data sections of these papers teaches you more about building a VLA than reading the model sections.

Model (Year)OrgParamsRobot DataLanguage SourceAction Representation
RT-1 (2022)Google35M~130k episodes, 13 robots, 17 months, ~700 tasksTemplated instructionsDiscrete tokens, 256 bins (arxiv.org/abs/2212.06817)
RT-2 (2023)Google DeepMind12B / 55BRT-1 data, co-fine-tuned with web-scale VLM dataTemplated + web textActions as text tokens (arxiv.org/abs/2307.15818)
Octo (2024)UC Berkeley et al.27M / 93M800k trajectories from Open X-EmbodimentMixed, dataset-dependentDiffusion head, continuous (arxiv.org/abs/2405.12213)
OpenVLA (2024)Stanford et al.7B970k episodes from Open X-EmbodimentMixed OXE instructionsDiscrete tokens (arxiv.org/abs/2406.09246)
pi-zero (2024)Physical Intelligence~3BOn the order of 10k hours, 7 platforms, 68 task familiesNatural + segment-level relabelingFlow matching, 50 Hz continuous (arxiv.org/abs/2410.24164)
GR00T N1 (2025)NVIDIA2BData pyramid: web video + synthetic + real robot dataMixed human + generatedContinuous, diffusion-based (arxiv.org/abs/2503.14734)

Three lessons sit in that table. First, scale climbed from 130k episodes to roughly a million in two years, but the biggest capability jumps (RT-2 over RT-1, pi-zero over Octo-class models) came from mixture changes, not just volume. Second, OpenVLA at 7B outperformed the 55B RT-2-X on the paper’s 29-task evaluation suite, which tells you curated cross-embodiment data can substitute for an order of magnitude of parameters. Third, nobody serious trains on robot data alone anymore; co-training against web-scale vision-language corpora is standard because it is what keeps semantic knowledge (what “the leftmost ripe banana” means) alive while the model learns motor control.

Core Data Modalities for VLA Training

Modality choice determines what your VLA can learn and what your collection rig must capture. The main axes are viewpoint (egocentric vs exocentric), depth strategy (mono vs stereo), and collection method (teleoperation vs human video).

Egocentric vs Exocentric Views

Egocentric data is captured from the robot’s or demonstrator’s own viewpoint; exocentric data is captured from external cameras watching the workspace. Wrist and head cameras give the policy view-invariant, occlusion-realistic inputs and tend to transfer better across scene layouts. Exocentric views give annotators and QA reviewers the context to verify task success and label segments. In our pipelines we treat exocentric streams as partly a QA instrument: an episode with only a wrist view is roughly twice as expensive to verify because reviewers must scrub proprioception logs to confirm success.

Mono vs Stereo

Mono capture records a single RGB stream per viewpoint; stereo capture records calibrated pairs that support depth estimation. Most published VLAs train on mono RGB because the backbone VLMs are mono. Stereo earns its extra cost on contact-rich and clutter-heavy manipulation, where depth ambiguity is a dominant failure mode. Our rule of thumb: mono for pretraining breadth, stereo for the fine-tuning set on your target tasks.

Teleoperation vs Human Video

Teleoperation produces the gold standard because the action stream is the robot’s own. Leader-follower rigs like ALOHA (arxiv.org/abs/2304.13705) hit high dexterity at a hardware cost around $20k per station; VR-based rigs are cheaper and faster to train operators on but add pose-retargeting noise. Human egocentric video (Ego4D, EgoExo4D scale) has no action labels, so it enters VLA training as a co-training or pretraining signal, the approach GR00T N1 formalizes as a data pyramid. Human video buys you visual and behavioral priors cheaply; it never replaces the teleop layer where actions live.

Action Representation: Tokenization vs Continuous Actions

Action representation is the choice of how robot actions are encoded for the model to predict, and it silently rewrites your data spec. There are two dominant families.

Discrete action tokenization (RT-1, RT-2, OpenVLA) bins each action dimension, typically into 256 buckets, and treats action prediction as next-token prediction. It plugs directly into a language-model backbone and tolerates modest control rates. The FAST tokenizer (arxiv.org/abs/2501.09747) pushed this further with a compression-based scheme that makes autoregressive VLAs viable on high-frequency data.

Continuous action heads (Octo’s diffusion head, pi-zero’s flow matching) regress action chunks directly. They excel at dexterous, high-rate control (pi-zero runs 50 Hz) but they punish sloppy capture. Timestamp jitter between frames and actions that a tokenized model shrugs off will smear a flow-matching target distribution.

What this means for data buyers, from our QA logs:

  • For tokenized targets, 10-15 Hz aligned capture is usually sufficient; invest the savings in task diversity.
  • For continuous heads, capture at 30-60 Hz with hardware-timestamped sync; we hold frame-to-action skew under 10 ms on our teleop rigs because beyond that we can measure it in fine-tune loss.
  • Action-chunk prediction (introduced with ACT on ALOHA) means episodes must be free of teleoperator pauses mid-chunk, which is a QA check most teams add only after their first bad fine-tune.

Language Annotation: The Layer Everyone Underestimates

Language annotation is the process of attaching instructions to robot episodes, and it is where VLA datasets most often quietly fail. A VLA is only as language-conditioned as its labels are diverse.

Templated vs natural instructions. RT-1-era datasets used templates (“pick X”, “move X near Y”). Templates are cheap and consistent, and they teach the model a grammar of about a dozen verbs. Models trained on templated instructions follow paraphrases poorly; the semantic generalization RT-2 demonstrated came from the web co-training, not the robot labels. Current practice, visible in the pi-zero and DROID (arxiv.org/abs/2403.12945) pipelines, is natural free-form instructions plus paraphrase augmentation.

Episode-level vs segment-level labeling. Episode-level labeling attaches one instruction to a whole demonstration. Segment-level labeling breaks a long-horizon episode into sub-tasks (“open the drawer”, “place the spoon inside”, “close the drawer”) with aligned timestamps. Segment labels cost more but unlock long-horizon training and better credit assignment. In our pipeline, segment-level labeling costs roughly 2.5x the episode-level pass because annotators must scrub video and mark boundaries, not just watch and describe.

Our first-hand benchmark: a language annotation pass adds $8-15 per hour of robot data depending on instruction density and whether we run single or dual annotation. We also run an instruction diversity QA gate: across any 1,000-episode batch we require minimum thresholds for unique verbs, unique object references, and spatial-relation phrases, because we have watched fine-tunes on label-poor batches lose the ability to follow anything but the majority phrasing.

Data Mixtures, Co-Training, and Cross-Embodiment Transfer

A data mixture is the weighted combination of datasets a VLA trains on, and mixture design is now a first-class engineering discipline. Three decisions dominate.

Web co-training ratio. RT-2 established that co-fine-tuning on web vision-language data alongside robot data preserves semantic breadth. Teams that fine-tune on robot data alone consistently report the model “forgetting” open-vocabulary grounding.

Cross-embodiment weighting. Open X-Embodiment showed that pooling data across 22 robot types improves average success, and OpenVLA and Octo both hand-tuned per-dataset mixture weights rather than sampling uniformly. Transfer across embodiments is real but not free: it appears strongest between similar morphologies (single-arm manipulators with parallel grippers) and weakest into dexterous hands and humanoids, which is exactly why humanoid programs still commission embodiment-matched collection.

There is no published universal mixture ratio, and be suspicious of anyone who quotes one. What the papers do agree on is the shape of the curve: heavily downweight any single dataset that would dominate by timestep count, keep a meaningful web co-training fraction throughout fine-tuning rather than dropping it to zero, and upweight the small datasets that match your target embodiment and camera geometry. In practice we see teams land between 10% and 40% embodiment-matched data by timestep in their final fine-tuning mixtures, with the exact point set by held-out evaluation rather than by principle. Measure mixtures in timesteps or tokens, not episodes; episode lengths vary enough between sources that episode-level accounting quietly misstates composition by 2-3x.

Diversity vs depth. Once a task passes a demonstration floor (Mobile ALOHA showed strong results co-training with as few as 50 demonstrations per task on top of a broad base, arxiv.org/abs/2401.02117), the marginal episode of task 12 is worth less than the first episode of task 13. When we rebalance client collections, we usually shift budget from episode count toward scene, object, and instruction diversity, and the downstream evaluations reward it.

Cost and Economics: What VLA Training Data Actually Costs

VLA data cost is driven by four stacked line items: rig amortization, operator time, annotation, and QA. Vendors who quote a single opaque per-episode price are hiding this stack. Here is ours, from DexSet production benchmarks (round figures, typical ranges we see):

Cost ComponentTypical RangeNotes
Teleop collection (VR rig, tabletop tasks)$28-38 per robot-hourIncludes operator, station amortization, resets
Teleop collection (leader-follower, bimanual/contact-rich)$40-60 per robot-hourALOHA-class rigs, slower resets, higher operator skill
Language annotation, episode-level$8-10 per data-hourNatural instructions, single pass
Language annotation, segment-level + paraphrases$12-15 per data-hourTimestamped sub-task boundaries, dual pass on 10%
QA and success verification$5-9 per data-hourSuccess labels, sync checks, instruction diversity gate
Useful episodes per collection hour20-40 tabletop; 8-15 long-horizonAfter discarding failed/aborted episodes

Worked example: a 2,000-hour bimanual manipulation corpus with segment-level language and full QA lands between $114k and $168k. Against that, note that pi-zero-class results were built on roughly 10,000 hours. This is why mixture design and cross-embodiment pretraining matter commercially: nobody fine-tuning a foundation model should be paying to recollect the base layer that OXE-scale open data already provides. Pay for the embodiment-matched, task-matched, well-labeled top of the pyramid.

Case Study Proof: Scaling a Fine-Tuning Corpus for a Humanoid Team

A humanoid foundation model team came to us with an OpenVLA-style base model and a fine-tuning problem: strong tabletop scores, weak performance on their bimanual kitchen tasks, and instructions that only worked when phrased like the training templates. We scoped a 1,400-hour teleoperation collection across 42 task families with a hard instruction-diversity requirement (no template allowed to exceed 8% of a batch) and segment-level labels on all long-horizon episodes.

The mixture, not the volume, did the work. Their prior corpus had 3x our episode count but 9 task families and 14 instruction templates. After fine-tuning on the new corpus blended 60/40 with their legacy data, their internal evaluation showed task success on held-out kitchen tasks roughly doubling, and paraphrased-instruction success moved from near-random to parity with template phrasing. We report those as directional results from the client’s own evaluation harness, not audited benchmarks. The full breakdown is in our case study write-up.

Scoping Your Own Collection: The RFP Scorecard

A VLA data RFP scorecard is a structured checklist for comparing data vendors on the dimensions that predict fine-tune quality. If you take one action from this guide, make vendors answer these in writing:

  • Frame-to-action sync tolerance, in milliseconds, with measurement method.
  • Control and capture rates, and whether timestamps are hardware or software.
  • Instruction sourcing: templated, natural, or paraphrase-augmented, with a diversity metric per batch.
  • Episode-level vs segment-level labeling, priced separately.
  • Success-labeling protocol and inter-annotator agreement.
  • Cost per robot-hour, broken into collection, annotation, and QA. Refuse bundled per-episode pricing.
  • Delivery format (LeRobot-compatible schemas save your team weeks).

We publish ours as a downloadable template. [Download the VLA Data RFP Scorecard] and use it against us too.

Related reading this week:

Next Step

If you are scoping a VLA data collection this quarter, two options. Book a demo and we will walk through our teleop rigs, annotation pipeline, and the instruction diversity QA gate live. Or download sample data: a free LeRobot-format sample pack of bimanual teleop episodes with segment-level language labels, so your team can inspect sync quality before you talk to anyone.

Frequently Asked Questions

What is training data for vision-language-action (VLA) models?

It is a corpus of robot demonstration episodes pairing synchronized camera observations and robot actions with natural-language instructions. VLA models train on it, usually via imitation learning on top of a pretrained vision-language backbone, to map images plus an instruction to robot actions.

Pretraining-scale efforts use hundreds of thousands of episodes (OpenVLA used ~970k from Open X-Embodiment; pi-zero reports on the order of 10,000 hours). Fine-tuning an existing VLA to a new embodiment or task set typically needs far less: the literature shows meaningful results from 50-150 demonstrations per task on top of a broad base, with 500-2,000 hours being a common commercial fine-tuning corpus.

In DexSet’s benchmarks, teleoperation collection runs $28-60 per robot-hour depending on rig and task complexity, language annotation adds $8-15 per data-hour, and QA adds $5-9. A 2,000-hour fully annotated corpus typically lands between $110k and $170k.

Not for most pretraining, since mainstream VLA backbones consume mono RGB. Stereo or depth earns its cost on contact-rich, cluttered, or precision tasks in your fine-tuning set, where mono depth ambiguity is a leading failure mode.

Only partially. Human egocentric video has no robot action labels, so it serves as a pretraining or co-training signal (the GR00T N1 data pyramid approach), improving visual and behavioral priors. The action-labeled teleoperation layer remains mandatory for the policy to output executable control.

Tokenized VLAs (RT-2, OpenVLA) discretize each action dimension into bins and predict actions as tokens, which suits language-model backbones and moderate control rates. Continuous-action VLAs (pi-zero with flow matching, Octo with diffusion) regress action chunks directly, enabling 50 Hz dexterous control but demanding tighter timestamp sync in the training data.

Case Study: How We Scaled Data Capture Hardware for Embodied AI for a VLA Model

Two numbers sat in the same planning deck: 40 captured hours a week, and 8,000 hours due in five months. Both were accurate, and they could not both survive. Hitting 8,000 hours in roughly 22 weeks means averaging about 370 delivered hours a week, nine times what the floor was producing; at the actual run rate, the dataset would have arrived roughly four years late, well after the funding milestone it was supposed to unblock. This is the point where a VLA foundation model team brought the problem to us.

The gap was not effort, and that is the thesis of this case study: scaling capture is an architecture problem (sync, formats, parallel cheap seats), not an effort or premium-hardware problem. Their two-person capture team worked hard on good hardware, a single ALOHA-class station and a Vision Pro teleop pilot. The gap was architecture: no sync strategy across devices, no shared episode format, and a fleet plan that scaled capex faster than throughput. This is the most common shape of the scaling problem we see, so we are publishing the anonymized playbook.

This post walks through the three phases of the engagement: the audit, the hardware re-spec, and the scale-out, with the real throughput and cost numbers at each stage. If you are sizing a capture floor for VLA fine-tuning, the tables below are the ones we wish every team had before their first purchase order.

DexSet operates egocentric, teleoperation, and exocentric capture lines in production; this engagement ran on our floors with the client’s task list and QA criteria. Per our client agreements, the team is anonymized (“a VLA foundation model team”) and all numbers are rounded operational figures.

Key Takeaways – A VLA foundation model team needed 8,000 hours of manipulation data in five months; their in-house rate was 40 hours a week. We reached a sustained 400 hours a week by week nine. – The fix was mostly architectural: hardware sync, one episode format (LeRobot-compatible HDF5), and parallel cheap seats instead of premium single rigs. – Fleet mix at full scale: 6 GELLO-equipped arm cells, 3 ALOHA-class bimanual stations, 12 Quest 3 teleop seats, 20 UMI-style grippers, and one 6-camera D455 evaluation studio. – Delivered cost settled at $31-42 per teleop hour across task families, inside our standard $28-60 benchmark range.

Phase 1: The Audit (Weeks 1-2)

A capture audit is a measured baseline of usable hours per seat per shift, and it always starts by separating captured hours from delivered hours. The client’s 40 weekly hours were captured hours; after QA, delivered hours were closer to 26. Two findings explained most of the loss.

First, synchronization. The Vision Pro pilot streamed hand pose to the robot over Wi-Fi with no shared clock, and QA was rejecting roughly a quarter of episodes for observation-action misalignment beyond their 25 ms tolerance. Second, format debt: the ALOHA station wrote its own HDF5 layout, the Vision Pro stack wrote JSON pose logs plus video, and an engineer spent about a day a week converting between them.

Neither problem is exotic. Both are invisible until you measure delivered hours instead of captured hours.

Phase 2: The Hardware Re-Spec (Weeks 3-5)

A hardware re-spec is a redesign of the fleet around delivered cost per hour rather than device quality, and ours cut the premium hardware first. The Vision Pro seats moved to evaluation-only duty. For fleet teleop we standardized on Quest 3 headsets at roughly $500 per seat: seven times cheaper per seat, no measurable difference in demonstrations per operator-hour on the client’s pick, place, and insertion task families, and cheap enough to hold 20 percent spares.

For arm-based capture we kept the existing ALOHA-class station (fine bimanual tasks justified it) and added GELLO leader arms (arxiv.org/abs/2309.13037) at about $300 per arm on follower robots the client already owned. For task families that did not need force or proprioception fidelity, we added UMI-style handheld grippers (arxiv.org/abs/2402.10329) at roughly $400 per unit, with a budgeted SLAM QA pass.

The last addition was a six-camera RealSense D455 evaluation studio, hardware-synced through the D455’s trigger pin, wrapped around one teleop cell. Every evaluation episode was therefore captured ego and exo simultaneously, which the client’s research team used to test viewpoint generalization in the style of Ego-Exo4D (arxiv.org/abs/2311.18259). The studio cost about $2,700 in cameras and roughly the same again in truss, sync wiring, lighting, and NVMe ingest, a ratio worth budgeting for in advance.

Every line wrote one format: LeRobot-compatible episodes (github.com/huggingface/lerobot) with per-frame timestamps from a shared NTP-disciplined clock and a hardware sync signal on the camera side. The conversion engineer got their day back.

Phase 3: Scale-Out (Weeks 6-9)

Scale-out is the replication of a proven seat design in parallel, and it only works after yield per seat is stable. We added seats in weekly increments, holding the QA gate constant, until the floor hit the target run rate.

Metric Baseline (client in-house) Week 5 (re-spec live) Week 9 (full scale)
Captured hours / week 40 130 ~460
Delivered hours / week (post-QA) 26 110 ~400
QA rejection rate ~35% 15% 10-12%
Active seats 3 14 42
Fleet capex (cumulative) ~$32k ~$68k ~$118k
Delivered cost per teleop hour not tracked $46 $31-42

Two numbers deserve emphasis. The rejection rate fell from 35 percent to under 12 percent before most of the new seats arrived; sync and format fixes, not hardware volume, did that. And full-scale fleet capex, about $118k for 42 seats, is less than many teams spend on four premium bimanual cells. Cheap synchronized seats, bought after the yield problem was solved, are what made the 8,000-hour target arrive on schedule.

The non-hardware work mattered too, and it is easy to undercount. Operator onboarding became a two-day curriculum with a certification task instead of an afternoon of shadowing, which pulled new-seat ramp time down from three weeks to one. The QA gate ran four automated checks (sync residual, calibration freshness, trajectory smoothness, format validity) plus human review on a 10 percent sample, and its thresholds never moved during scale-out. Holding the gate constant is what made the weekly delivered-hours number trustworthy enough to plan a training schedule against.

What We Would Do Differently

Honest retrospectives are rarer than case studies, so here is ours. We would have moved the UMI-style gripper line earlier in the schedule; its SLAM post-processing pipeline took three weeks to tune, and starting it in week 3 instead of week 6 would have added several hundred delivered hours. We also underestimated storage: the exo studio’s terabyte-per-shift output forced a mid-project NVMe retrofit that a day of arithmetic would have predicted. Neither mistake threatened the deadline. Both are now checklist items in every new engagement.

What Generalizes From This Engagement

The transferable lessons are hardware-selection rules, and they match the decision matrix in our full guide to data capture hardware for embodied AI:

  • Measure delivered hours, not captured hours. The 14-hour weekly gap at baseline was invisible in the client’s dashboards.
  • Fix sync before buying anything. A 25 ms alignment tolerance is unreachable over ad-hoc Wi-Fi streaming without a shared clock.
  • Premium headsets are evaluation tools, not fleet tools. Quest 3 matched Vision Pro on demonstrations per operator-hour for standard manipulation families.
  • Match rig fidelity to task family. ALOHA-class cells for fine bimanual work, GELLO for arm tasks on owned robots, UMI for volume, one format across all of them.
  • Scale last. Every seat added before yield stabilizes multiplies your rejection rate.

Next Step

Ready to scope your data program? Talk to our team.

Frequently Asked Questions

How long does it take to scale a robot data capture operation?

In this engagement, nine weeks from audit to a sustained 400 delivered hours per week. The first five weeks fixed synchronization, formats, and seat design; scaling seats was the fast part.

About $118,000 in cumulative fleet capex for 42 seats: 12 Quest 3 teleop seats, 6 GELLO arm cells, 3 ALOHA-class stations, 20 UMI-style grippers, and a 6-camera RealSense D455 evaluation studio.

On a well-synchronized floor we hold 10 to 12 percent. Rates above 25 percent almost always trace to clock misalignment or ergonomic problems, not operator error.

Not for fleet capture. On pick, place, and insertion tasks, ~$500 Quest 3 seats matched the $3,499 Vision Pro on demonstrations per operator-hour. The Vision Pros stayed in service for gaze-labeled evaluation episodes, where their eye tracking earns the price.

Yes; the phases (audit, re-spec, scale-out) and rules above are the playbook. The vendor case is throughput on demand without capex and hiring, which mattered here because of the five-month deadline.

[Book a Demo] and we will run the throughput math on your task list, or start with the full guide to data capture hardware for embodied AI.

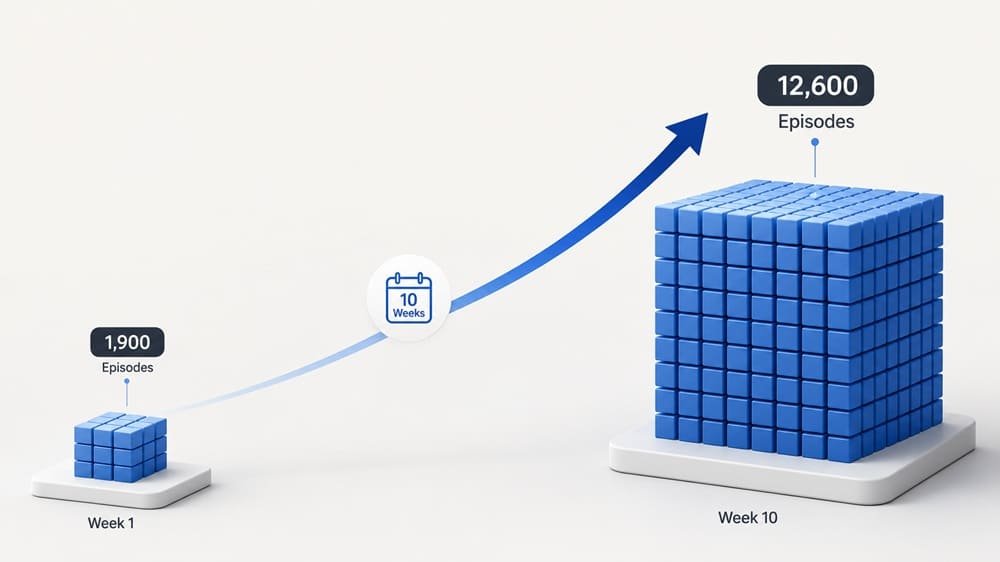
Case Study: Scaling Teleoperation Data for a VLA Model, 1,900 to 12,600 Episodes in Ten Weeks

A head of data once asked us which of their 1,900 collected episodes had actually made their policy better, and we could not tell them; neither could they, because nothing in their pipeline had ever connected episodes to outcomes. That question came from the team this case study is about: eight weeks into their own collection effort, 1,900 episodes against a 12,000-episode target, a 34 percent QA rejection rate, and a training deadline that had already slipped once. Their ML team was strong. Their collection operation was two engineers moonlighting as floor managers, and it showed.

This is the common failure shape, and it is the thesis of this case study. Collection stalls not because anyone lacks skill but because demonstration data is an operations problem wearing an ML costume: staffing, ergonomics, and QA gating, none of which appear in the papers. The papers do tell you what is possible; ACT hit 80 to 90 percent success from about 50 clean demos per task (arxiv.org/abs/2304.13705). Getting 12,000 clean demos across 40 tasks is a different discipline.

Here is exactly what we changed, week by week, including the two things that failed. Use it as a template for your own program, or as an argument for not running one in-house.

Key Takeaways – Baseline: 1,900 episodes in 8 weeks, 34 percent rejection. Outcome: 12,600 QA-passed episodes in 10 weeks, 12 percent final rejection. – Six leader-follower stations plus a two-week operator certification program did most of the work. – Automated ingest QA (sync skew, smoothness, completion gates) cut silent data loss to near zero. – Client’s ACT baseline improved from 41 to 68 percent average success across their internal 40-task eval. – Peak steady-state: about 1,400 usable episodes per week from 8 operators.

The Starting Point: Why 1,900 Episodes Took Eight Weeks

The client’s bottleneck was a stack of small losses, not one big one. Their audit told the story: two VR stations shared among rotating volunteers, no defined operator roles, no reset protocol, and QA performed manually by an ML engineer, at training time, weeks after collection. Rejection ran 34 percent, dominated by timestamp skew between their 50 Hz action logs and 30 fps cameras, plus inconsistent initial states that made half the “passing” episodes weak training signal anyway.

Their effective yield was under 60 usable episodes per day. At that rate the 12,000-episode target sat more than eight months out.

What We Changed

The intervention had four parts: stations, people, protocol, and gates. In order of impact:

1. Stations. We replaced the two shared VR rigs with six bimanual leader-follower stations (GELLO-class leaders on the client’s arms, roughly $300 per leader plus fabrication), keeping one VR station for the mobile-base tasks where it fit better. Joint-level control cut trajectory hesitancy immediately and shortened operator ramp.

2. People. Eight dedicated operators on a two-week certification program: task cards, reset drills, and a throughput gate (20 usable episodes per hour on a reference task) before touching production tasks. Our standard ramp curve applied; novices started at 8 to 12 usable episodes per hour and certified operators stabilized at 25 to 40.

3. Protocol. Written task cards for all 40 tasks, marked randomization zones for object placement, success criteria defined at collection time, and per-episode metadata (task, operator, rig, success) attached at the source.

4. Gates. Automated ingest QA running nightly: inter-stream sync skew over 33 ms flagged, dropped-frame counts, jerk thresholds on joint trajectories, and completion labels verified against a sampled human review. Failures routed back to the floor as next-morning feedback per operator, which mattered as much as the gate itself.

The Week-by-Week Numbers

Weekly usable output tells the ramp story better than any narrative.

Week Usable episodes Rejection rate Notes
1 310 29% Station bring-up; operators in certification
2 540 26% First cohort certified; jig redesign after reset failures
3 980 19% All 8 operators on production tasks
4 1,390 15% Steady state reached
5 to 9 1,300 to 1,450/wk 11 to 14% Two task cards rewritten after eval feedback
10 1,280 12% Target passed: 12,600 total QA-passed

Two failures worth admitting. In week two, our first reset jig for a deformable-object task increased reset time instead of cutting it; operators beat the jig by hand and we scrapped it. And one of the 40 tasks, bimanual jar opening, ran a stubborn 25 percent rejection until week six, when slowing the commanded demonstration pace fixed what better hardware had not.

Did the Data Actually Help? Policy Results

The point of episode counts is policy performance, so the client re-trained their ACT baseline on the new corpus at week eleven. Average success across their internal 40-task evaluation went from 41 percent (trained on their original 1,900 mixed-quality episodes) to 68 percent, with the largest gains on precision tasks where the old VR data had been noisiest. Same architecture, same hyperparameter budget, different data. Their team’s summary, which we will keep quoting: “We spent six months on model changes for less improvement than ten weeks of better data.”

That is one program, not a controlled study, and we flag it as such. But it matches the pattern across our floors and the published record: demonstration quality moves policy success more reliably than architecture iteration at this stage of the field.

What We Would Do Differently

Every program teaches something, and this one taught us three corrections we have since made standard. First, we would start the operator certification cohort a full week before station bring-up finishes, not after. Waiting for hardware serialized two ramps that could have run in parallel, and it cost the program most of week one’s output. Second, we would pilot every task card ourselves before handing it to operators. Two of the 40 cards contained ambiguous success criteria (“lid secured” without a torque or rotation definition), and the resulting label inconsistency did not surface until the week-five training run flagged suspicious loss on exactly those tasks. A ten-minute pilot per card would have caught both. Third, we would set the deformable-object tasks to a slower commanded pace from day one. The week-six discovery that pace, not hardware, drove the jar-opening rejection rate had been sitting in the per-task rejection data since week two; we were looking at floor-level averages and missed it. Per-task dashboards are now default on every program we run.

None of these are exotic lessons. That is rather the point: scaling demonstration data is a discipline of small, boring corrections applied early, and the gap between 1,900 episodes and 12,600 episodes was made of exactly such corrections.

The Reusable Checklist

Scaling teleoperation collection comes down to seven decisions made early:

  • Match rig to task family (leader-follower for fine bimanual work; VR for mobile/humanoid tasks)
  • Dedicated, certified operators, never rotating volunteers
  • A throughput gate before production collection
  • Written task cards with randomization zones and success criteria
  • Hardware timestamps on every stream; sync checked at ingest, not at training
  • Nightly automated QA with per-operator feedback loops
  • A rejection buffer of at least 15 percent in the episode target

Rig options, cost-per-episode math, and QA thresholds are covered in depth in the complete teleoperation data collection guide.

Next Step

Ready to scope your data program? Talk to our team.

Frequently Asked Questions

How many episodes does a VLA model program need?

Program-dependent, but the humanoid teams we support typically target 10,000 to 50,000 QA-passed episodes per quarter across dozens of tasks. Single-task ACT policies can work from about 50 clean demos; multi-task generalization is what drives volume.

With rigs, certified operators, and ingest QA in place, expect three to four weeks to steady state. This program reached about 1,400 usable episodes per week from 8 operators by week four.

At least 15 percent at maturity and 25 to 30 percent during the first two weeks of any new task or rig. Budgeting zero rejection is the most common planning error we see.

In-house costs more than teams expect once engineer time is counted; the client here spent eight engineer-weeks producing data that mostly failed QA. Outsourcing wins on time-to-data in most cases; in-house wins when collection is itself a core competency you intend to build.

Rig fidelity and QA gating together. Joint-level leader-follower control removed trajectory hesitancy, and ingest gates stopped skewed episodes from reaching training. Success rose from 41 to 68 percent with no model changes.

Why Teleoperation Data Is the Biggest Bottleneck in Physical AI

In a budget review we sat in on last quarter, a founder approved a seven-figure compute reservation in about ten minutes, then spent the next hour interrogating a $70k line for demonstration data. The compute felt legible: dollars per GPU-hour, a market price. The data line had no equivalent, because nobody in the room could say what an hour of human demonstration work actually yields.

That asymmetry is the subject of this post, and the thesis is blunt: physical AI is not compute-bound, it is demo-bound. Language models trained on the internet. Vision models trained on the internet. Robot foundation models have no internet of action-labeled data, so every demonstration a VLA model consumes had to be manufactured: a person, at a rig, doing a task, one episode at a time. That production rate, not FLOPs, sets the pace of the field.

The gap exists because physical interaction data cannot be scraped. YouTube shows what hands do but not the joint torques, gripper commands, and proprioceptive states a policy needs as action labels. Simulation helps but leaks reality at every contact. That leaves teleoperation as the primary source of ground-truth action data, and teleoperation runs at human speed.

This post puts numbers on the bottleneck: how slow collection actually is, where the throughput hides, and the three levers that move it. The benchmarks are first-hand from our collection floors; the dataset math comes from published sources.

Key Takeaways – DROID, one of the largest open manipulation datasets, is 76,000 episodes and about 350 hours of interaction collected across 13 institutions (arxiv.org/abs/2403.12945). An LLM ingests more tokens than that dataset’s total information content in seconds. – A trained operator produces 25 to 40 usable episodes per hour. A novice produces 8 to 12. The ramp takes two to three weeks. – QA rejects 10 to 30 percent of episodes. Most teams forget to budget for it. – The three scaling levers, in order of impact: operator retention, task and rig ergonomics, automated QA at ingest.

The Bottleneck, Quantified

The teleoperation bottleneck is the mismatch between how fast foundation models can consume demonstration data and how fast humans can produce it. Consider what “large” means in robotics. Open X-Embodiment pooled over one million trajectories from 22 embodiments, drawing on years of collection by dozens of labs (arxiv.org/abs/2310.08864). DROID took 76,000 episodes across 564 scenes and stands as a landmark effort. Meanwhile a single humanoid program we support wants 50,000 episodes per quarter, for one product.

Run the arithmetic. At 30 usable episodes per operator-hour, 50,000 episodes is roughly 1,700 operator-hours before rejection. Add a realistic 15 percent QA rejection and you are near 2,000 hours: one operator working full-time for a year, or ten operators for five weeks, assuming every one of them is already trained. They will not be.

Where the Throughput Actually Goes

Throughput loss in teleoperation programs comes from three places: the operator ramp curve, episode overhead, and QA rejection. Each one quietly halves your effective rate if ignored.

The operator ramp curve is the two-to-three-week climb from novice to trained throughput. Our benchmarks are consistent: new operators deliver 8 to 12 usable episodes per hour in weeks one and two, then 25 to 40 once bimanual coordination and reset discipline become automatic. That is a 3x difference, which makes operator churn the most expensive line item nobody tracks. Lose a trained operator and you do not lose a salary; you lose three weeks of peak yield.

Episode overhead is everything between demonstrations: scene resets, object randomization, rig checks, breaks. On contact-rich tasks with careful resets, overhead can consume 40 percent of a shift. Task card design and reset tooling (marked object regions, reset jigs) pull that down more than exhortation ever will.

QA rejection runs 20 to 30 percent on a new task or rig and 10 to 15 percent in a mature pipeline. Sync skew between the 50 Hz action log and 30 fps cameras is the top rejection reason we see, followed by hesitant trajectories and failed completions. Rejection discovered at training time, weeks after collection, is pure loss; rejection at ingest is a correctable signal.

The Three Levers That Move the Number

Scaling teleoperation data collection means attacking retention, ergonomics, and ingest QA, in that order.

Lever Typical gain Cost to implement
Operator retention and certification program Sustains 25 to 40 eps/hr vs repeated novice resets Low: pay, scheduling, progression path
Rig and task ergonomics (leader-follower feel, reset jigs) 20 to 40 percent throughput on contact-rich tasks Medium: GELLO-class leaders ~$300/arm, jig fabrication
Automated QA at ingest (sync, smoothness, completion gates) Recovers the 10 to 30 percent otherwise lost silently Medium: one engineer-month, then near-zero marginal

A note on hardware, since teams often reach for it first. Moving from a $500 VR setup to a $20k ALOHA-class station improves fidelity on fine manipulation, and the original ACT results (80 to 90 percent success from about 50 demos, arxiv.org/abs/2304.13705) show what a well-matched rig enables. But hardware does not fix churn, and it does not fix silent QA loss. We have seen $300 GELLO leaders outproduce premium stations purely because the operators stayed.

A Worked Example: Sizing a 25,000-Episode Program

Program sizing is the exercise of converting an episode target into stations, headcount, and calendar time, with ramp and rejection built in rather than bolted on. Here is the arithmetic for a representative target of 25,000 QA-passed episodes in one quarter.

Start from the end. With a 15 percent rejection buffer, 25,000 passed episodes means collecting about 29,400. A trained operator averaging 30 usable episodes per hour, working six productive hours per shift, yields 180 episodes per day. Naively that is 164 operator-days, or three operators for the quarter. The naive answer is wrong in three ways.

First, ramp. If all three operators start as novices at 10 episodes per hour, the first three weeks produce a third of plan, which costs you roughly 5,000 episodes against the target. Either hire ahead of need or extend the calendar. Second, absence and churn. Floors run at 80 to 90 percent of rostered capacity over a quarter; one resignation among three operators is a 33 percent capacity event plus a new ramp curve. Third, task mix. Contact-rich bimanual tasks run at the bottom of the throughput range, and new tasks spike rejection to 20 to 30 percent for their first two weeks regardless of operator skill.

The sizing that actually holds: five operators across three stations (stations can run staggered shifts), a certification cohort starting two weeks before production, and a rejection buffer that starts at 25 percent for week one of each new task and decays to 15 percent. At $28 to $60 per all-in operator hour, the labor line for the quarter lands between roughly $27k and $70k depending on region and task complexity. That is the honest shape of the bottleneck: not impossible, just physical.

What This Means for Your Roadmap

The practical conclusion is that demonstration data needs the same planning rigor as compute. If your model roadmap says “100k episodes by Q2,” the collection plan behind it should specify stations, operator headcount with ramp assumptions, a rejection buffer of at least 15 percent, and an ingest QA gate that runs nightly. Teams that treat collection as an afterthought discover the bottleneck at the worst possible time: after the training cluster is reserved.

The full playbook, including rig selection tables and per-episode cost math, is in our complete guide to teleoperation data collection.

Next Step

Ready to scope your data program? Talk to our team.

Frequently Asked Questions

Why is teleoperation data the bottleneck in physical AI?

Because action-labeled interaction data cannot be scraped from the web; it must be produced by human operators at 25 to 40 usable episodes per hour at best. Model capacity and compute scale far faster than human demonstration throughput.

Our benchmarks: 8 to 12 usable episodes per hour for a novice, rising to 25 to 40 after two to three weeks of ramp. Contact-rich bimanual tasks sit at the low end, simple pick-place at the high end.

Multi-task training typically needs thousands of episodes per skill family. For reference, Open X-Embodiment pooled over one million trajectories from 22 embodiments, and single-task ACT policies can succeed with about 50 clean demonstrations.

Expect 20 to 30 percent rejection on new tasks or rigs and 10 to 15 percent in a mature pipeline. The top causes are timestamp skew between streams, dropped frames, and failed task completions.

Not yet for contact-rich manipulation. Simulation supplements real data and helps with evaluation, but sim-to-real gaps in contact dynamics and perception mean most production policies still train primarily on real teleoperated demonstrations.

Teleoperation Data Collection for Robot Learning: The Complete 2026 Guide

Midway through a humanoid data program last year, our cost per usable episode rose almost 40 percent in a single week, and for two days nobody could explain it. Every rig passed its health checks. The QA gates were green. The answer had nothing to do with hardware or pipelines: two trained operators had left, their replacements were producing at novice rates, and the ramp math did the rest. Papers make demonstration collection look like a solved problem. In production, it is a staffing, hardware, and QA operation that most ML teams have never run before.

That week is this guide in miniature, and it carries the thesis the whole page argues: teleoperation data collection is an industrial operation, not an ML task, and it succeeds or fails on operational levers. It is part hardware engineering (leader arms, cameras, time sync), part human operations (hiring, training, and retaining operators), and part data engineering (formats, QA, versioning). Underestimate any one leg and the dataset comes out late, expensive, or unusable.

This guide covers the full stack: what teleoperation data collection actually is, the five main rig approaches and what they cost, the economics of operator labor, how demonstrations turn into trained policies, and the QA thresholds that separate usable datasets from expensive noise. The numbers on operator throughput, cost per hour, and rejection rates come from our own collection floors; the hardware and algorithm claims come from the primary literature (ALOHA, GELLO, UMI, DROID, Open-TeleVision), cited throughout.

TL;DR – Teleoperation data collection is the process of recording synchronized robot actions and sensor observations while a human remotely controls the robot through a task, producing demonstrations for imitation learning. – Five rig families dominate: leader-follower arms (ALOHA, ~$20k bimanual), low-cost kinematic leaders (GELLO, roughly $300 per arm), VR controllers/headsets (Quest 3, Vision Pro), 6-DoF desktop devices (SpaceMouse), and robot-free handheld capture (UMI). – Realistic all-in operator cost runs $28 to $60 per teleop hour. Novice operators produce 8 to 12 usable episodes per hour; trained operators reach 25 to 40 within two to three weeks. – Expect 10 to 30 percent QA rejection. Budget for it up front or your episode targets will slip. – 50 clean demonstrations trained with ACT reached 80 to 90 percent success on fine bimanual tasks in the original ALOHA work. Quality compounds; volume alone does not.

What Is Teleoperation Data Collection?

Teleoperation data collection is the process of recording a robot’s proprioceptive states, actions, and camera observations while a human operator remotely controls the robot through a task, producing time-aligned demonstration episodes used to train imitation learning policies. Each episode is a synchronized log: joint positions and velocities, commanded actions, gripper state, and multiple camera streams, typically stored in HDF5 or the LeRobot dataset format (github.com/huggingface/lerobot).

The entity chain matters for anyone mapping this space. Teleoperation produces demonstrations. Demonstrations feed imitation learning algorithms such as ACT (Action Chunking with Transformers, arxiv.org/abs/2304.13705) and Diffusion Policy (arxiv.org/abs/2303.04137). Those policies, scaled across tasks and embodiments, become the training substrate for vision-language-action (VLA) models. Open X-Embodiment aggregated over one million trajectories across 22 robot embodiments largely from teleoperated sources (arxiv.org/abs/2310.08864). No teleop data, no VLA.

A useful mental model: a teleop episode is worth exactly as much as its worst-synchronized stream. A 50 Hz action log paired with a camera that drifted 80 ms out of alignment teaches the policy that objects move before the hand does. That single failure mode wastes more training budget than any other we see.

Core Concepts and Data Modalities

A teleoperation dataset is defined by four things: the action space, the observation streams, the control and capture rates, and the episode structure. Get these right before collecting a single demo, because retrofitting a format after 10,000 episodes is miserable.

Action Space and Leader-Follower Mapping

Leader-follower joint mapping is the control scheme in which a human moves a small “leader” arm and a “follower” robot arm mirrors those joint positions in real time. ALOHA uses this directly: two WidowX-class leader arms drive two ViperX 300 followers, joint to joint, which gives operators immediate kinesthetic intuition and avoids inverse kinematics singularities (arxiv.org/abs/2304.13705). GELLO takes the same idea and rebuilds the leader from hobby-grade Dynamixel servos and printed parts for roughly $300 per arm (arxiv.org/abs/2309.13037). VR and SpaceMouse rigs instead command end-effector poses and rely on an IK solver, which is cheaper but introduces its own artifacts near joint limits.

Observation Streams: Mono, Stereo, Wrist, and Overhead

Observation streams are the camera and sensor feeds recorded alongside actions, and their placement determines what the policy can actually learn. The standard manipulation setup is one or two exocentric (scene) cameras plus one wrist camera per arm. Stereo pairs or depth add geometric grounding for tasks with occlusion. Our default rig records three RGB streams at 640×480, 30 fps, plus joint states at the control rate. Egocentric head cameras matter for humanoid teleop, where systems like Open-TeleVision stream an actively controlled head view into the operator’s headset (arxiv.org/abs/2407.01512).

Control Rate vs Camera Rate: The 50 Hz / 30 fps Problem

The rate mismatch problem is the timing gap created when actions are logged at 50 Hz but cameras capture at 30 fps, leaving no camera frame for two out of every five action steps. ACT-style pipelines handle this by training on the nearest or interpolated frame and predicting action chunks (sequences of 50 to 100 future actions) rather than single steps, which smooths over per-step jitter. What the algorithm cannot fix is unsynchronized clocks. Hardware-timestamp every stream at the source, log in one process or use a shared monotonic clock, and record the offsets. In our QA pipeline, any episode with inter-stream skew above 33 ms (one camera frame) is auto-flagged, and it is the single most common rejection reason on new rigs.

Episode Structure and Task Definition

An episode is one complete attempt at a defined task, from a randomized initial state to a labeled terminal state. Discipline here is what makes a dataset trainable: written task cards, explicit reset procedures, randomized object poses within a marked region, and a per-episode success label assigned at collection time. Datasets that skip initial-state randomization produce policies that memorize a table layout instead of learning a skill.

The Five Rig Approaches Compared

Rig choice is the decision that fixes your cost floor, your data quality ceiling, and which tasks you can collect at all. There is no universal winner; there is a right answer per task family and budget.

Approach Example system Hardware cost Control fidelity Operator ramp Best for Weakness
Bimanual leader-follower ALOHA (Stanford) ~$20k; Mobile ALOHA ~$32k with base Joint-level, 50 Hz, kinesthetic Fast (days) Fine bimanual manipulation Cost per station; fixed embodiment
Low-cost kinematic leader GELLO ~$300 per leader arm + robot Joint-level, high Fast Scaling stations cheaply on arms you own Build/maintenance effort; per-robot tuning
VR headset + controllers Quest 3 rigs; Open-TeleVision style $500 to $3,500 + robot Pose-level via IK, medium-high Medium (1 to 2 weeks) Humanoids, mobile manipulation, immersive tasks IK artifacts, some operator fatigue/sim sickness
6-DoF desktop device 3Dconnexion SpaceMouse $150 to $450 + robot Pose-level, low-medium Slow for contact-rich work Simple pick-place, lab prototyping Slow, unintuitive for dexterous or bimanual tasks
Robot-free handheld UMI gripper Under $1,500 per device Demonstrations without a robot Fast In-the-wild diversity, pre-robot data Embodiment gap; SLAM-dependent pose quality

Three field notes that the spec sheets miss. First, DROID, one of the largest open manipulation datasets (76,000 episodes, 350 hours, 564 scenes), was collected with a Meta Quest 2 controller driving a Franka arm, proof that consumer VR hardware scales to serious datasets (arxiv.org/abs/2403.12945). Second, GELLO is the highest-throughput-per-dollar option if you already own the follower arms, but plan for a part-time technician; printed leaders drift and servos strip. Third, UMI (arxiv.org/abs/2402.10329) is the only approach that collects before your robot ships, which makes it a strong hedge for teams still finalizing hardware.

For a deeper head-to-head, see our companion piece on comparing teleoperation approaches.

Economics: What Teleoperation Data Actually Costs

The true cost of teleoperation data is operator hours multiplied by an all-in rate, divided by usable episode yield, and most budgets get all three numbers wrong. Hardware is the smaller line item; a $20k ALOHA station running two shifts amortizes to under $3 per collection hour over a year. Labor and QA dominate.

Our first-hand benchmarks, consistent across programs we run:

Cost and throughput factor Typical range (our benchmarks)
All-in operator cost (wages, supervision, facility, hardware amortization) $28 to $60 per teleop hour
Novice operator throughput (weeks 1 to 2) 8 to 12 usable episodes per hour
Trained operator throughput (week 3 onward) 25 to 40 usable episodes per hour
QA rejection rate (mature pipeline) 10 to 15 percent
QA rejection rate (new task or new rig, first 2 weeks) 20 to 30 percent
Effective cost per usable episode roughly $0.90 to $6.00 depending on task complexity

Two implications fall out of that table. The operator ramp curve is a 3x throughput difference, so operator retention is a data-cost lever bigger than any hardware decision; churn resets you to novice yield. And QA rejection compounds against you: a 10,000-episode target with 25 percent rejection means collecting 13,300, not 10,000. We cover the bottleneck math in detail in why teleoperation data is the bottleneck in physical AI.

ROI framing for buyers: at $40 per hour all-in and 30 usable episodes per hour, a 50,000-episode dataset costs about $67k in collection labor before QA overhead. Compare that against three to six months of two ML engineers building and debugging an in-house collection operation, and outsourced collection frequently wins on time even when it ties on cost.

From Demonstrations to Policy: The Imitation Learning Pipeline

The imitation learning pipeline is the sequence that converts teleoperated demonstrations into an evaluated robot policy: collect episodes, convert to a training format, train ACT or a diffusion policy, then measure real-world success rate. The pipeline is short; the feedback loop is what teams underuse.

  • Collect and QA. Episodes stream into storage with per-episode metadata (task, operator, rig, success label). QA gates on sync skew, dropped frames, trajectory smoothness, and task success.
  • Convert. HDF5 or ROS 2 bags convert to LeRobot format for training and sharing on Hugging Face.
  • Train. ACT with action chunking (predicting ~100-step action sequences at 50 Hz) or Diffusion Policy for multimodal action distributions.
  • Evaluate. Fixed evaluation protocol: N rollouts per task with randomized initial states, report success rate.
  • Loop. Failure modes from evaluation define next week’s collection priorities.

The proof point worth anchoring on: the original ACT work reached 80 to 90 percent success on fine bimanual tasks such as cable routing and battery insertion from only 50 demonstrations per task (arxiv.org/abs/2304.13705). Demonstration quality and consistency, not raw volume, set that outcome. We have watched 400 sloppy episodes lose to 120 clean ones on the same task, same architecture. Collect less, reject more, retrain sooner.

Case Study Proof: Scaling a VLA Data Program

A humanoid foundation model team came to us needing 12,000 QA-passed bimanual episodes across 40 household tasks in ten weeks, after their in-house effort had produced 1,900 episodes in eight weeks with a 34 percent rejection rate. We stood up six leader-follower stations, ran a two-week operator certification program, and enforced automated sync and smoothness gates at ingest. By week four the floor was producing 1,400 usable episodes per week; the program closed at 12,600 QA-passed episodes with a 12 percent final rejection rate, and the team’s ACT baseline improved from 41 to 68 percent average task success on their internal eval. The full breakdown, including what failed in weeks one and two, is in the VLA case study.

Standing Up a Collection Program: The First 30 Days

A collection program launch is a 30-day sequence of hardware bring-up, protocol authoring, operator certification, and QA gate activation, in that order. Teams that compress or reorder it pay the cost back with interest in weeks five through eight. Our standard sequence:

Days 1 to 7: rigs and clocks. Assemble stations, calibrate cameras (record intrinsics and extrinsics per rig, per calibration), and prove time sync before anyone collects a demonstration. Log a physical sync event (a clapboard works) and verify every stream lands within one camera frame. A day spent here saves a re-collection later; skew discovered after 5,000 episodes is not fixable in post.

Days 8 to 14: protocol. Write task cards for the first five tasks: success criteria, reset procedure, randomization zones marked physically on the workspace, and expected episode duration. Pilot each card yourself before an operator touches it. Every ambiguity you leave in a task card becomes a labeling inconsistency in the dataset.

Days 15 to 28: certification. Run operators through reference tasks with a throughput bar (we use 20 usable episodes per hour) and a quality bar (QA pass rate above 80 percent) before production collection begins. Expect the standard ramp: 8 to 12 usable episodes per hour early, 25 to 40 after two to three weeks.

Day 30: gates on. Nightly automated QA becomes mandatory, with per-operator, per-rig reports every morning. From this point, the program self-corrects.

Build vs Buy: The Honest Decision Criteria

The build-versus-buy question comes down to whether demonstration collection is a competency your team needs to own or a supply problem it needs solved. Building makes sense in three cases: your embodiment is unusual enough that no vendor has matching rigs, your data requirements are small (under roughly 5,000 episodes), or collection know-how is itself part of your product thesis. Buying makes sense when the deadline is the constraint. The math from the economics section applies either way, but in-house programs carry two costs that rarely appear in the comparison spreadsheet: the two to four engineer-months of pipeline and QA tooling before the first reliable episode, and the management overhead of running an operations floor inside an ML organization. We are a vendor, so discount our view accordingly; then ask any team that has run both models which cost they underestimated.

Free Resource: Teleoperation Data RFP Scorecard

A vendor RFP scorecard is a weighted rubric for comparing teleoperation data providers on the criteria that actually predict dataset quality. Ours scores ten dimensions, including sync guarantees, QA rejection transparency, operator training programs, format deliverables, and per-episode pricing disclosure. Most vendors will not publish cost per hour; make them fill in the sheet. [Download the RFP scorecard (XLSX)] and use it on us too.

Related reading: 5 hidden challenges in teleoperation data collection.

Next Step

If you are scoping a demonstration data program, two options. Download 10 free teleoperation episodes (HDF5 plus synchronized MP4, three camera views, 50 Hz actions) and run them through your training stack. Or book a 30-minute scoping call with our data operations team and leave with a per-episode cost estimate for your task list. [Download Sample Data] | [Book a Demo]

Frequently Asked Questions

What is teleoperation data collection?

Teleoperation data collection is the recording of synchronized robot actions, joint states, and camera observations while a human operator remotely controls the robot through a task. The resulting episodes train imitation learning policies such as ACT and diffusion policies, which underpin VLA models.

Our all-in benchmark is $28 to $60 per operator hour, covering wages, supervision, facility, and hardware amortization. With trained operators producing 25 to 40 usable episodes per hour, effective cost lands between roughly $0.90 and $6.00 per usable episode depending on task complexity.

Fewer than most teams assume, if quality is high. The original ALOHA/ACT results reached 80 to 90 percent success on fine bimanual tasks with about 50 demonstrations per task. Multi-task and VLA training raises the requirement into the thousands per skill family, which is where collection economics start to dominate.

It depends on the task family and budget, per the comparison table above. Fine bimanual manipulation favors leader-follower rigs (ALOHA at ~$20k, or GELLO leaders at ~$300 per arm on robots you own). Humanoid and mobile tasks favor VR teleop. Robot-free UMI capture wins when hardware has not shipped yet.

The main causes are inter-stream time skew above one camera frame, dropped frames, jerky or hesitant trajectories, failed task completions, and reset protocol violations. Expect 20 to 30 percent rejection in the first two weeks on a new task and 10 to 15 percent once the pipeline matures.

Yes. UMI-style handheld grippers record demonstrations with a wrist-mounted camera and SLAM-derived poses, no robot required. The trade-off is an embodiment gap when transferring to your platform, so most teams use it to supplement, not replace, on-robot teleop.

HDF5 per episode and the LeRobot dataset format are the current de facto standards; ROS 2 bags are common at capture time. Whatever the container, require hardware timestamps on every stream and per-episode metadata (task, operator ID, rig ID, success label).

Case Study: How We Scaled Egocentric Data Collection for Robotics for a VLA Model

Picture yourself as the head of data at a humanoid startup: your researchers have just validated the experiment that could anchor the next funding round, co-training human egocentric video with your teleop corpus improves policy generalization, and then you run the arithmetic on your own collection capacity and find the experiment wants ten times more human data than your team can produce this year. That is exactly where one humanoid foundation model team (unnamed here by agreement) was standing when they contacted us. Their result was in line with what EgoMimic-style research had reported (arXiv:2410.24221); their teleop dataset was around 400 hours and growing slowly.

Why was a well-funded team stuck? Because collection was competing with research for the same people. Every hour their engineers spent managing capture logistics was an hour not spent on training runs, and their pilot attempts at crowdsourced collection had returned footage with unusable sync and a rejection rate far beyond anything a program can absorb. Familiar story; we hear a version of it most months.

This post is the anonymized production log of what happened next: how we scoped, staffed, and delivered 4,000 QA-passed hours of egocentric data in 14 weeks, what it cost per hour, where we lost yield, and the three decisions that mattered most. Numbers are real from our program tracking, rounded to protect the client. The thesis the whole log supports: scaled collection is a manufacturing problem, and the returns came from three protocol decisions made before hour one, not from capture volume.

Key Takeaways – 4,000 QA-passed egocentric hours delivered in 14 weeks across three task families (kitchen, warehouse shelving, assembly bench) for a humanoid VLA co-training pipeline. – Blended cost landed in the $22 to $34 per hour band: mono-heavy capture for breadth, stereo for depth-critical tasks, dense hand-pose annotation on only the 30 percent of hours flagged retarget-critical. – First-pass QA yield started at 71 percent in week one and reached 86 percent by week six after protocol fixes; the delta was worth roughly $18K. – Camera height matched to the robot’s head frame and constrained “robot-plausible” motion instructions were the two protocol choices the client’s researchers valued most. – The client reported improved success on unseen-object manipulation evaluations versus their robot-only baseline after co-training on the mixed corpus.

The Brief: What “Scaled” Actually Meant

Scaling egocentric data collection means hitting a volume target at a defined quality bar and annotation depth on a fixed calendar, and all four variables were specified before we captured an hour. The brief we agreed with the client’s head of data:

  • Volume: 4,000 QA-passed hours (not raw hours; the distinction is the whole game).
  • Task families: kitchen manipulation, warehouse shelf pick-and-place, small-parts assembly bench, weighted 45/35/20.
  • Viewpoint constraint: camera height within 10 cm of the robot’s head frame; field of view overlapping the deployment camera’s.
  • Annotation: temporal task segmentation on everything; 3D hand pose and object tracks only on episodes their researchers flagged as retarget-critical, which settled at about 30 percent of hours.
  • Format: episode-structured delivery compatible with their LeRobot-based ingestion (github.com/huggingface/lerobot).

That last 30 percent decision deserves emphasis. Dense annotation on all 4,000 hours would have added roughly $10 per hour across the corpus, $40K of spend their training plan did not need. Annotation depth should follow the training mechanism; this program is why we repeat that line so often.

The Setup: Rigs, People, Protocol

Our production setup for this program combined two rig families, 26 trained collectors, and a task protocol written jointly with the client’s researchers in week zero. Rig split:

  • GoPro-class mono head rigs at 4K/60 for the breadth corpus, where the consumer was encoder pretraining and temporal understanding.
  • RealSense D455 helmet rigs for depth-critical assembly and shelving tasks, where metric 3D fed their grasp analysis.

The protocol work is what separated this from “wearing cameras at work.” Every task became a card: start state photo, goal condition, allowed object set, retry rule, and, critically, motion constraints. Collectors were instructed to keep grasps within the robot’s gripper envelope (no five-finger tricks a parallel-jaw gripper cannot imitate), avoid motions outside the robot’s reach profile, and re-stage rather than improvise when a scene drifted off-spec. We borrowed episode discipline from how public robot datasets are structured; if it cannot be expressed as a clean episode, the way entries in Open X-Embodiment are (arXiv:2310.08864), it does not ship.

The Numbers: Timeline, Yield, and Cost

Program metrics are the honest core of any case study, so here is the phase table straight from our tracking, rounded:

Phase Weeks Hours Delivered (QA-Passed) First-Pass Yield Notes
Pilot + protocol iteration 1 to 2 120 71% Blur and sync failures dominated rejections
Ramp 3 to 6 900 78% rising to 86% Fixed exposure presets; re-trained 4 collectors
Steady state 7 to 12 2,400 85 to 88% ~420 hours/week across 26 collectors
Completion + re-delivery 13 to 14 580 87% Backfilled task-family gaps flagged by client

Cost landed where the pilot predicted: mono breadth hours in the low $20s per QA-passed hour, stereo depth-critical hours with dense annotation in the low-to-mid $30s, blending to $22 to $34 across the corpus. For context on how those bands compare across rigs and vendors, the economics section of our pillar guide has the full tables: The Complete Guide to Egocentric Data Collection for Robotics.

Where did the 12 to 29 percent of rejected hours go? Motion blur in fast kitchen tasks (fixed with shutter-priority presets), IMU packet loss on two aging rigs (retired), off-protocol grasps (re-training), and a stubborn tail of episodes with ambiguous outcomes (protocol clarification). Yield improvement from 71 to 86 percent was worth roughly $18K over the program, which is why we staff a protocol engineer for the first six weeks rather than treating capture as a solved problem.

The Three Decisions That Mattered

Looking back through the retro notes, three decisions carried most of the outcome:

1. Matching viewpoint geometry before hour one. Camera height within 10 cm of the robot’s head frame and overlapping FOV meant the client’s encoder saw deployment-like images from the first batch. This costs nothing at capture time and is nearly impossible to fix afterward.

2. Robot-plausible motion constraints. Instructing collectors to stay inside the gripper envelope narrowed the embodiment gap at the source instead of hoping retargeting would absorb it. Their researchers called this the highest-value protocol clause.

3. Two-tier annotation. Dense hand pose on 30 percent of hours, selected by the researchers who consumed it, kept the budget aligned with the training plan and cut roughly $40K of unneeded spend.

An honorable mention: weekly delivery instead of end-of-program delivery. The client’s researchers trained on batch one while we captured batch four, surfaced a task-family gap in week five, and we corrected course while the collectors were still staffed. On a single-delivery program, that gap would have been discovered after demobilization, when fixing it costs triple.

The Outcome, Stated Carefully

The client reported improved success rates on unseen-object manipulation evaluations after co-training on the mixed corpus versus their robot-only baseline; direction consistent with published ego-plus-robot co-training results, and we will not dress it in precise percentages that are theirs to publish, not ours. What we can state as first-hand fact: the corpus passed their ingestion validation on first delivery, the program hit its calendar, and they extended into a second phase covering exocentric paired capture.

Opinion, clearly flagged: I think the 10x-human-to-robot-hours ratio this team converged on will look conservative within two years. Human egocentric capture scales with people; teleop scales with robot fleets, and people are the cheaper fleet.

Running This Play for Your Team

If your co-training experiments are data-starved, the fastest way to de-risk a program like this is a scoped pilot: 50 to 100 hours against your protocol, with QA reports attached. Book a scoping call and bring your task list; we will bring the yield curves from programs like this one.

Frequently Asked Questions

How long does it take to collect 4,000 hours of egocentric robotics data?

In this program, 14 weeks end to end with 26 trained collectors, including a two-week pilot and protocol iteration phase. Steady-state throughput ran about 420 QA-passed hours per week.

The blended rate landed between $22 and $34 per QA-passed hour: mono breadth capture in the low $20s, stereo depth-critical hours with dense hand-pose annotation in the low-to-mid $30s.

Match camera height and field of view to the robot’s head frame, constrain grasps to the robot’s gripper envelope, keep motions inside its reach profile, and structure everything as clean episodes with defined start states and outcomes.

This program started at 71 percent first-pass yield and stabilized at 85 to 88 percent by week six. Budget for 15 to 25 percent rejection if you are starting fresh.

The client reported improved success on unseen-object manipulation evaluations after co-training the mixed corpus versus their robot-only baseline, consistent with published results such as EgoMimic. Exact figures are theirs to publish.

Case Study: How a Series B Humanoid Startup Rebuilt Data Procurement for Its VLA Model

Grasp success on the team’s fixed eval suite dropped six points in a single week, and for two days nobody could explain it. The model had not changed. The training code had not changed. What had changed, it eventually emerged, was a data batch: one of their three vendors had silently rescaled gripper actions between deliveries. The team had money, talent, and a working humanoid platform. What stalled their VLA program was procurement: three data vendors, three delivery formats, no shared acceptance spec, and an ML team that had quietly stopped trusting incoming data. By their own estimate, roughly a quarter of purchased hours never reached a training run.

Nothing about that situation was unusual. It is what happens when data purchasing grows by accretion: a vendor added for a demo push here, another for a task category there, each with its own definitions of “hour,” “annotated,” and “calibrated.” The result is not one data pipeline but several, with the training team as the manual integration layer.

This post walks through how the team rebuilt procurement in one quarter using the four artifacts from the Robotics Data Buyer’s Playbook: a spec-first RFP, a weighted scorecard, a red flags screen, and a 50-hour paid pilot. The client is anonymized (a Series B humanoid startup; we do not name customers), but the process and the numbers are the real pattern we see when buyers switch from improvisation to protocol. The thesis this case argues: pilots run under production conditions predict production performance, and paper evaluation alone does not.

DexSet was one of the vendors evaluated in this process, so we saw the RFP, the pilot, and the contract from the receiving side. That is exactly the vantage point a buyer should want documented.

Key Takeaways

  • Starting point: three vendors, three formats, ~74 percent average usable-hour yield, about one engineer-day of triage per delivery.
  • The rebuild: one written acceptance spec, an RFP to six vendors, a 10-criterion weighted scorecard, paid 50-hour pilots for the top two.
  • Pilot results diverged sharply: 90 percent yield with a positive policy delta versus 78 percent yield and a failed loader test.
  • Twelve weeks later: yield held within two points of the pilot across the first 1,000 contracted hours, and per-delivery engineering time dropped from a day to under an hour.

The Starting Point: Accretion, Not Architecture

The team’s data supply had accreted rather than been designed: each vendor relationship was created for a short-term need, and none was ever re-evaluated. Vendor A delivered undocumented HDF5 with a schema that shifted between batches. Vendor B delivered rosbag2 that had to be converted and re-timestamped. Vendor C delivered mp4s plus CSV joint logs with no sync guarantees at all.

The measurable symptoms, from their own tracking:

  • Average usable-hour yield around 74 percent across vendors, measured against the acceptance checks they eventually wrote down.
  • Roughly one engineer-day per delivery spent on conversion and triage.
  • Two training regressions in one quarter traced back to data batches, one to a sync drift issue, one to inconsistent gripper action scaling between vendors.

The trigger for change was mundane: a planning meeting where nobody could answer what an incremental 1,000 hours of manipulation data would actually cost, because nobody could say what fraction would be usable.

Step 1: Write the Spec Before Talking to Anyone

The acceptance spec is a short document that defines what a usable hour means for a specific program, and writing it was the most valuable week of the whole rebuild. Theirs fit on three pages: stereo egocentric plus wrist cameras at defined resolutions and frame rates, proprioception at 50 Hz minimum, time sync under 10 ms across all streams, a 60-task manipulation list with reset criteria, an annotation rubric, and delivery in LeRobot format with a schema doc, following the conventions the ecosystem inherited from Open X-Embodiment and the ALOHA line of work (arxiv.org/abs/2310.08864; arxiv.org/abs/2304.13705).

The immediate effect was that vendor quotes became comparable for the first time. The secondary effect was internal: the ML and data teams had to agree on what they were actually buying, which surfaced two silent disagreements about camera placement that had been corrupting cross-vendor consistency for months.

Step 2: RFP and Scorecard

The RFP went to six vendors with fifteen questions requiring numeric answers: committed usable-hour yield, sync tolerance and recheck cadence, audit accuracy, rig counts behind throughput claims, per-hour pricing by task complexity, pilot terms, and licensing. Four vendors answered with numbers. Two answered with adjectives and were dropped without further calls, which is the red flags screen doing its job cheaply.

The four remaining responses were scored independently by two people on the 10-criterion weighted scorecard (quality SLAs 15, modality coverage 12, calibration/sync 12, down to IP/licensing at 7). Independent scoring earned its keep in the reconciliation meeting: the two scorers disagreed by more than a point on only three criteria, and every disagreement traced to an ambiguous vendor answer rather than a difference in judgment. Those ambiguities went back to the vendors as written clarification requests, which is a politer and more useful outcome than one person’s optimism deciding the ranking.

The scoring separated the field more on contract terms than on hardware: two vendors wanted broad rights to reuse delivered episodes for other customers, which the team treated as disqualifying on the licensing criterion. Two finalists advanced.

Step 3: The 50-Hour Paid Pilots

Both finalists ran paid 50-hour pilots under production conditions, judged on four numbers fixed in the pilot agreements before capture began. This is the step that paper evaluation cannot replace, and the results diverged more than the scorecards had predicted.

Pilot metric (agreed in advance) Threshold Finalist 1 Finalist 2
Usable-hour yield vs acceptance spec ≥85% 90% 78%
Annotation accuracy (independent 5% re-label) ≥97% 98.2% 96.1%
Policy success delta on fixed 12-task eval Positive +6 points vs baseline +1 point
Loader time into LeRobot pipeline ≤1 engineer-day ~2 hours Failed (schema mismatches, 3+ days)

The policy-delta test deserves a note. The team fine-tuned the same fixed baseline policy twice, once on their existing mix, once with the 50 pilot hours added, and evaluated both on the same 12 tasks. Fifty hours is a small delta at VLA scale, and they treated it that way: not as proof of final performance, but as a canary. Data that helps at 50 hours might help at 1,000; data that does nothing at 50 hours is a warning you can act on before signing an annual contract.

Step 4: Contract and the Twelve Weeks After

The contract encoded the pilot numbers rather than replacing them with prose: yield commitment at 88 percent with redelivery of failures, sync tolerance and recalibration cadence as delivery requirements, LeRobot schema versioned in an appendix, quarterly re-audit rights, and no vendor reuse of delivered episodes.

The results over the first 1,000 contracted hours were unremarkable in the best sense. Yield held between 88 and 90 percent, within two points of the pilot. Engineering time per delivery fell from roughly a day to under an hour, because the format and schema were locked before signature instead of negotiated after each batch. The two silent disagreements about camera placement did not recur, because the spec, not tribal memory, was the reference.

The honest caveat: this process cost about five weeks end to end and roughly $7,000 in pilot fees across two finalists. For a team spending six figures annually on data, that insurance premium was around 5 percent of program cost. For a team buying 20 exploratory hours, it would be overkill, and we say so in the full playbook.

Next Step

Ready to scope your data program? Talk to our team.

Frequently Asked Questions

How much did the procurement rebuild cost compared to what it saved?

About five weeks of process time and roughly $7,000 in paid pilot fees. Against it: yield moved from ~74 to ~90 percent, and per-delivery engineering time dropped from a day to under an hour, which on a six-figure annual program repaid the process cost within the first deliveries.

Because scorecards rank paper, and paper can lie by omission. In this case the two finalists scored within a few points of each other, then diverged by 12 yield points and a failed loader test under production conditions.

It is enough to judge the vendor’s pipeline, not the model’s ceiling. Treat the policy success delta as a canary: positive movement at 50 hours justifies scaling; zero movement is a cheap warning.

The pilot numbers themselves: yield commitment with redelivery terms, sync tolerance as a delivery requirement, a versioned schema appendix, re-audit rights, and an explicit ban on vendor reuse of delivered episodes.